Wolfram Function Repository
Instant-use add-on functions for the Wolfram Language
Function Repository Resource:
Retrieve the nutrient content and daily value percentages of foods
ResourceFunction["NutritionLabelData"][amt, food] yields nutrient data as associations for a given amount of food. |
| "ExcludeZeroValues" | False | exclude properties with value of 0 |
| "OutputType" | Association | key→value |
| "Rounding" | True | rounds to the nearest integer |
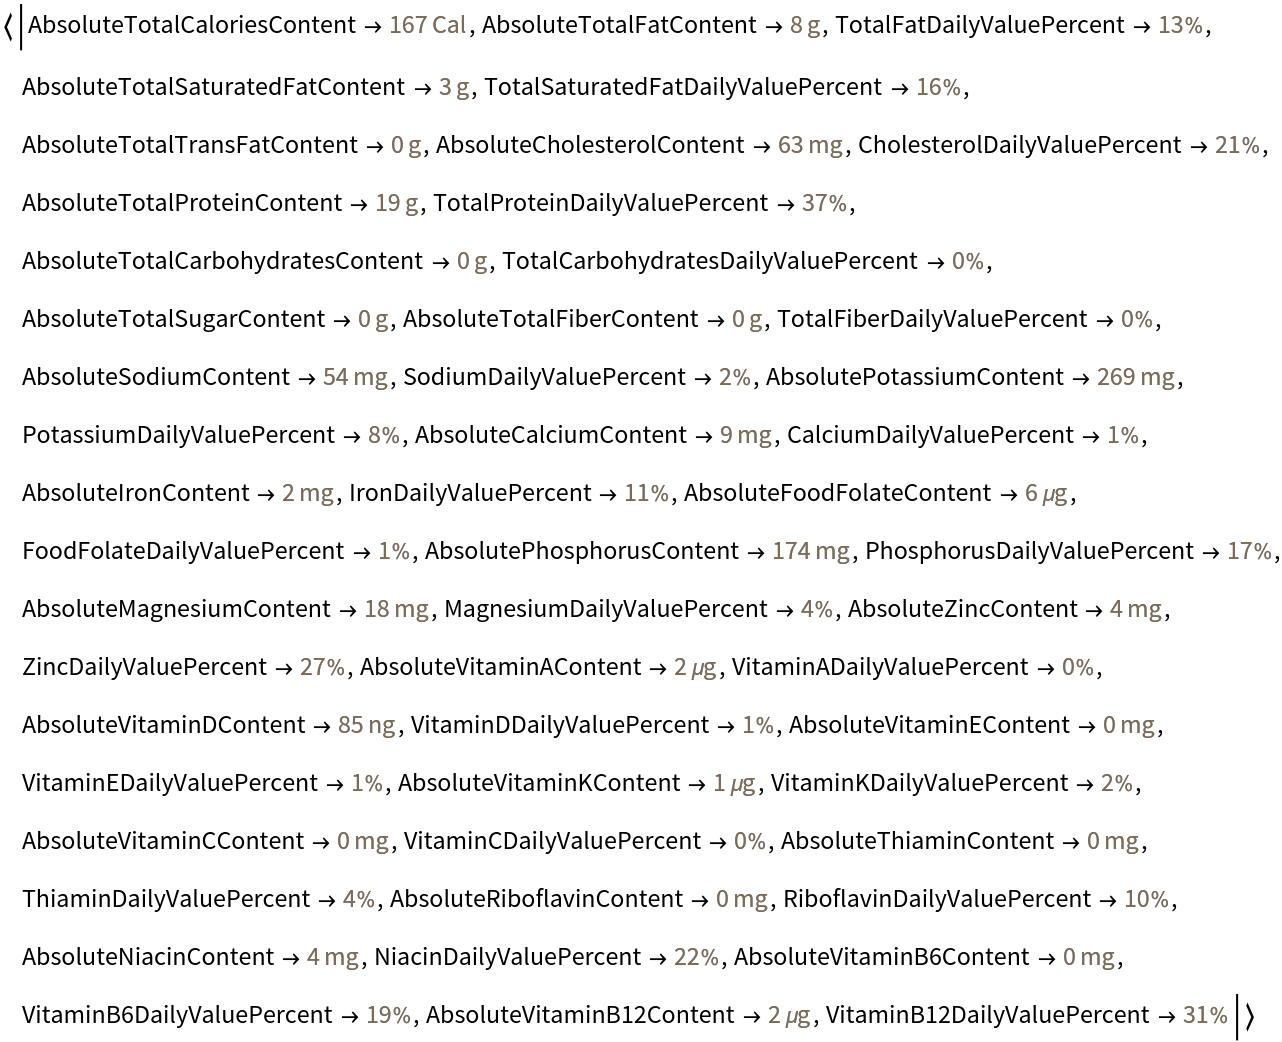
Enter a text string with a food and amount, then easily retrieve the nutrient data as associations:
| In[1]:= |
| Out[1]= |  |
Specify the Rounding option as False for more precise values:
| In[3]:= |
| Out[3]= | 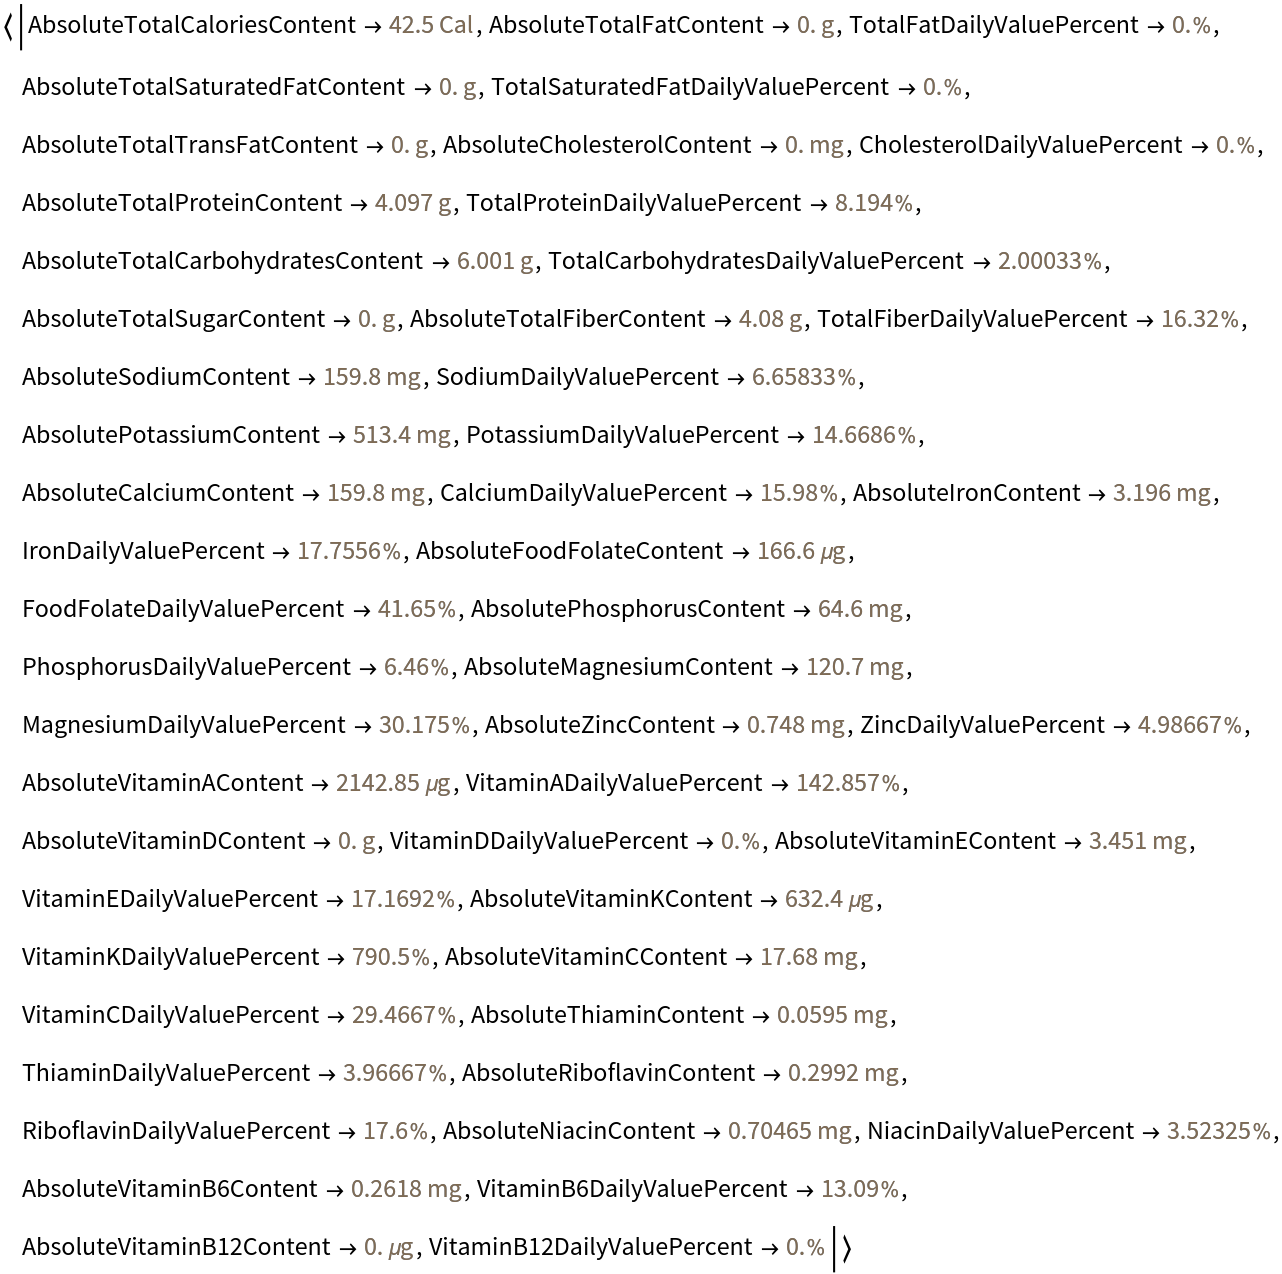 |
Also specify the ExcludeZeroValues option as True to exclude properties with a value of 0:
| In[4]:= |
| Out[4]= | 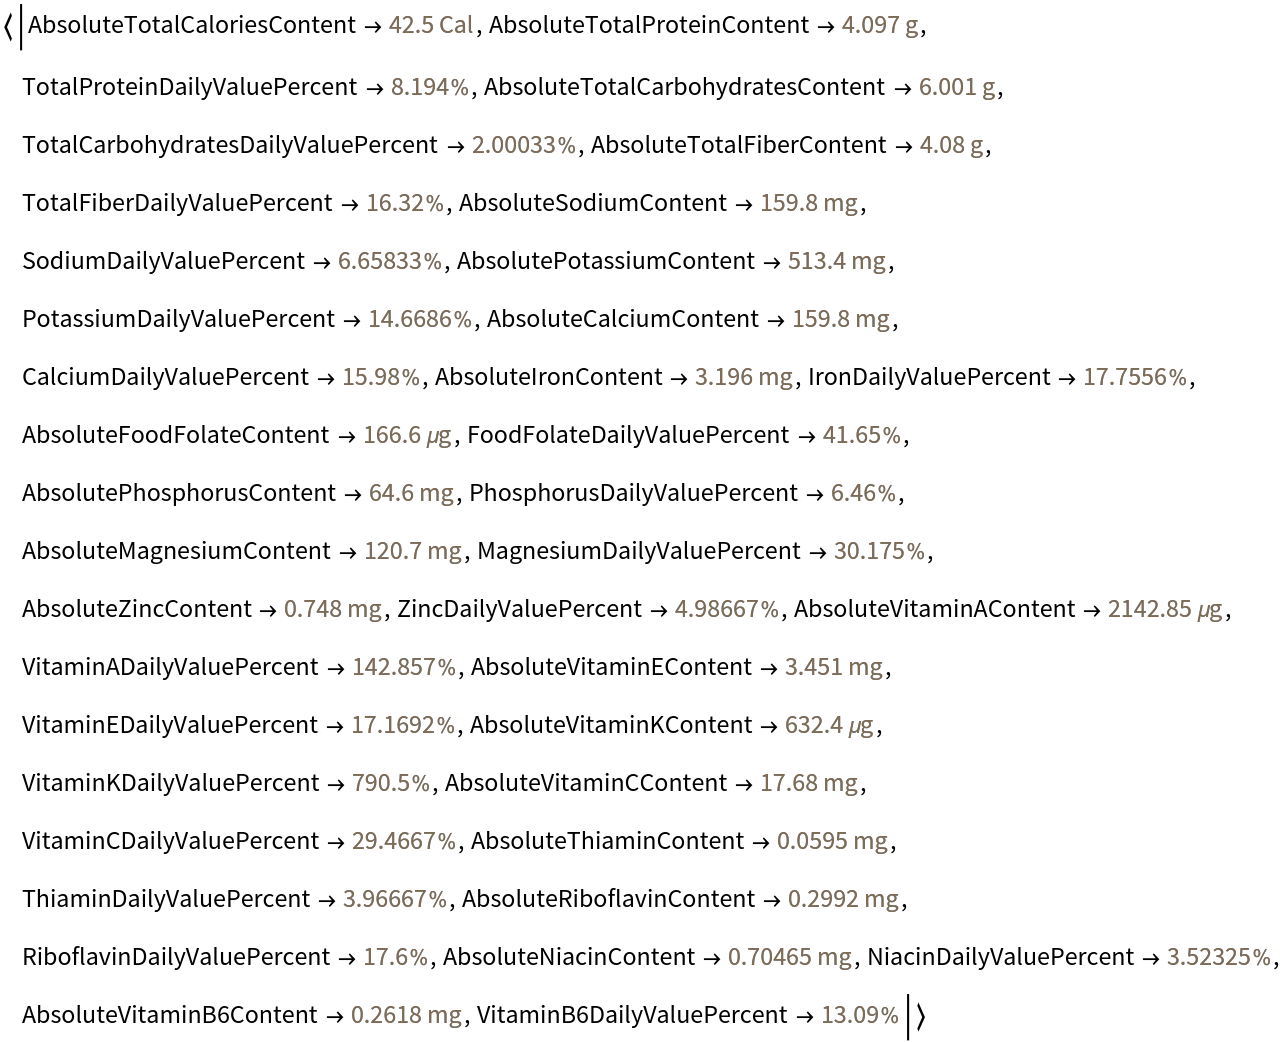 |
Retrieve a dataset instead of associations:
| In[5]:= |
| Out[5]= | 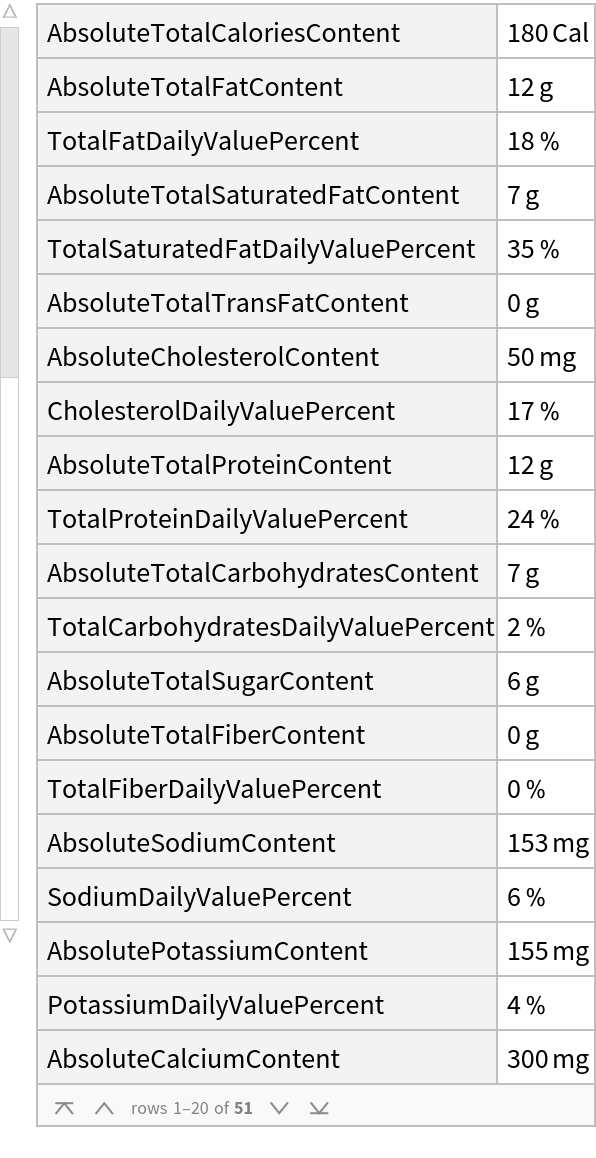 |
A message will be generated when a food or non-food item is not found in the database:
| In[6]:= |
There is limited data via NutritionLabelData for some fast-food branded items:
| In[7]:= |
| Out[7]= |
The nutrition data per typical serving size can be retrieved for these fast-food items via the EntityValue function:
| In[8]:= |
| Out[8]= |
| In[9]:= | ![entityData = DeleteMissing[
EntityValue[Entity["Food", "McDonaldsHamburgerHappyMeal::181qzm"], "Association"]];
KeySelect[entityData, StringContainsQ[ToString[#], "Serving", IgnoreCase -> True] &] // N](https://www.wolframcloud.com/obj/resourcesystem/images/228/22866726-3401-4f9d-a0c2-9f8c6758aed0/5cc119d8338a05b1.png) |
| Out[10]= | 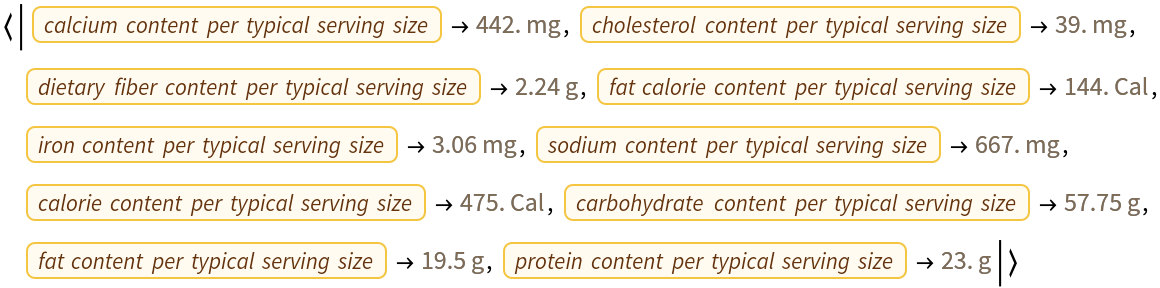 |
Create a bar chart to visualize the Daily Value percentages:
| In[11]:= | ![tofuData = ResourceFunction[
"NutritionLabelData", ResourceSystemBase -> "https://www.wolframcloud.com/obj/resourcesystem/api/1.0"]["5oz tofu"];
tofuValuePercents = KeySelect[tofuData, StringContainsQ[ToString[#], "Percent", IgnoreCase -> True] &];
chartLabels = StringTrim /@ Map[StringDelete["DailyValuePercent"], Keys[tofuValuePercents]];
BarChart[tofuValuePercents, PlotLabel -> "Percent of Daily Value Provided by 5oz Tofu", ChartLabels -> Placed[chartLabels, Below, Rotate[#, Pi/2] &], AxesLabel -> "%"]](https://www.wolframcloud.com/obj/resourcesystem/images/228/22866726-3401-4f9d-a0c2-9f8c6758aed0/54c862db4df18e9d.png) |
| Out[12]= | 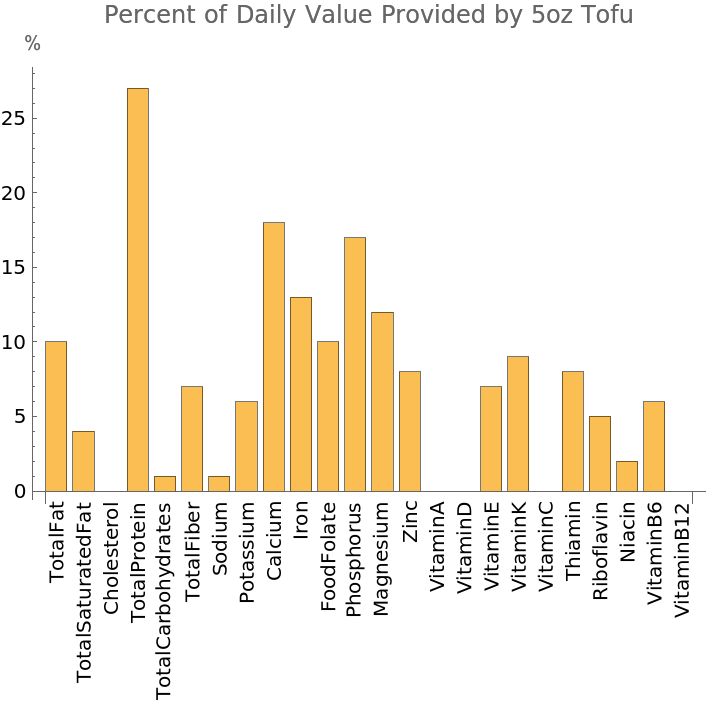 |
Reverse sort and customize the style of the chart:
| In[13]:= | ![tofuData = ResourceFunction[
"NutritionLabelData", ResourceSystemBase -> "https://www.wolframcloud.com/obj/resourcesystem/api/1.0"]["5oz tofu"];
tofuValuePercents = KeySelect[tofuData, StringContainsQ[ToString[#], "Percent", IgnoreCase -> True] &];
sortedTofuValuePercents = ReverseSortBy[Normal[tofuValuePercents], Last];
chartLabels = StringTrim /@ Map[StringDelete["DailyValuePercent"], sortedTofuValuePercents[[All, 1]]];
chartValues = sortedTofuValuePercents[[All, 2]];
BarChart[chartValues,
PlotLabel -> "Percent of Daily Value Provided by 5oz Tofu",
ChartLabels -> Placed[chartLabels, Below, Rotate[#, Pi/2] &],
ChartStyle -> "FallColors",
AxesLabel -> "%"]](https://www.wolframcloud.com/obj/resourcesystem/images/228/22866726-3401-4f9d-a0c2-9f8c6758aed0/2e9ab562dfaa32e2.png) |
| Out[14]= | 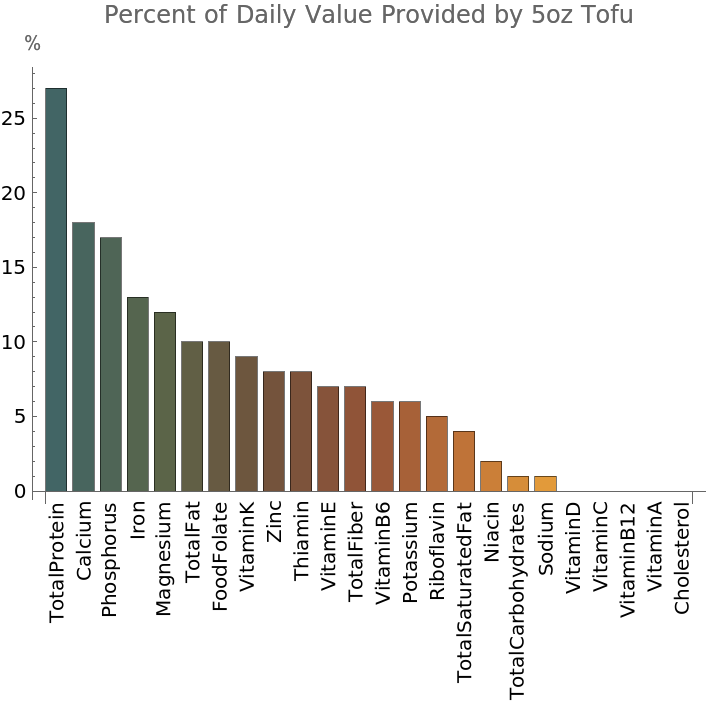 |
Wolfram Language 13.0 (December 2021) or above
This work is licensed under a Creative Commons Attribution 4.0 International License
![ResourceFunction[
"NutritionLabelData", ResourceSystemBase -> "https://www.wolframcloud.com/obj/resourcesystem/api/1.0"][
EntityInstance[Entity[
"Food", {EntityProperty["Food", "FoodType"] -> ContainsExactly[{
Entity["FoodType", "Beef"]}], EntityProperty["Food", "AddedFoodTypes"] -> ContainsExactly[{}]}],
Quantity[3, "Ounces"]]]](https://www.wolframcloud.com/obj/resourcesystem/images/228/22866726-3401-4f9d-a0c2-9f8c6758aed0/10133a6c934096d0.png)