Wolfram Function Repository
Instant-use add-on functions for the Wolfram Language
Function Repository Resource:
Calculate the kurtosis of a list along with its uncertainty
ResourceFunction["KurtosisAround"][{x1,x2,x3,…}] gives an Around object describing the kurtosis and corresponding uncertainty of the xi. |
Calculate the kurtosis of some numbers:
| In[1]:= |
| Out[1]= |
KurtosisAround works with symbolic expressions:
| In[2]:= |
| Out[2]= | 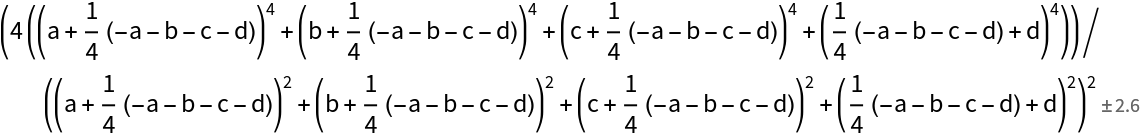 |
KurtosisAround also works with quantities with units, though the answer is dimensionless:
| In[3]:= | ![values = {Quantity[1, "Meters"], Quantity[1.1, "Meters"], Quantity[0.98, "Meters"], Quantity[0.99, "Meters"]};
ResourceFunction["KurtosisAround"][values]](https://www.wolframcloud.com/obj/resourcesystem/images/203/20384887-bcbd-4975-a128-7fc342f14bee/1beb3d7d0e728b83.png) |
| Out[4]= |
The kurtosis is independent of the units:
| In[5]:= |
| Out[5]= |
The standard error has an asymptote of ![]() where n is the number of data points:
where n is the number of data points:
| In[6]:= | ![Asymptotic[
2 Sqrt[(6 n (n - 1))/((n - 2) (n + 1) (n + 3))] Sqrt[(
n^2 - 1)/((n - 3) (n + 5))], n -> \[Infinity]]](https://www.wolframcloud.com/obj/resourcesystem/images/203/20384887-bcbd-4975-a128-7fc342f14bee/558ce97a357d8c1f.png) |
| Out[6]= |
KurtosisAround applied to symbolic expressions can get unwieldy fast:
| In[7]:= |
| Out[7]= |  |
At least four value are needed to give a plausible error estimate:
| In[8]:= |
| Out[8]= |
Try with 4 values:
| In[9]:= |
| Out[9]= |
Kurtosis can be Indeterminate, in which case there will not be an Around result:
| In[10]:= |
| Out[10]= |
Study the kurtosis and its uncertainty for a sequence of values and compare it to the theoretical value of the distribution (dashed):
| In[11]:= | ![SeedRandom[4321];
dist = SkewNormalDistribution[2, 3, 3];
vals = RandomVariate[dist, 10^7];
values = Table[{n, ResourceFunction["KurtosisAround"][Take[vals, n]]}, {n, Round[10^Range[1.25, Log10@Length[vals], 1/6]]}];
ListLogLinearPlot[values, PlotRange -> {{10, 10^7}, {1, 4}}, GridLines -> {{}, {Kurtosis[dist]}}, GridLinesStyle -> Dashed, AxesLabel -> {"Number of values", "Estimate of the kurtosis"}, ImageSize -> 500]](https://www.wolframcloud.com/obj/resourcesystem/images/203/20384887-bcbd-4975-a128-7fc342f14bee/588197a6e599523c.png) |
| Out[12]= | 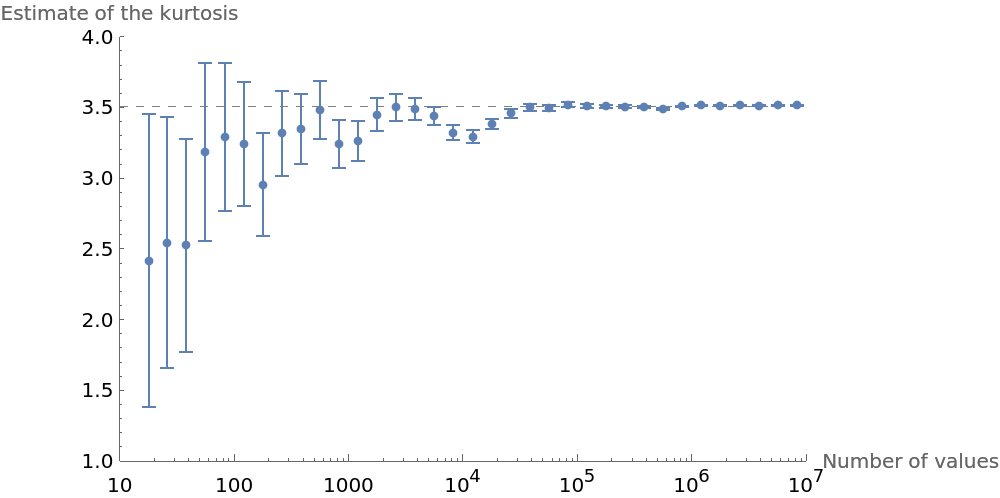 |
This work is licensed under a Creative Commons Attribution 4.0 International License