Wolfram Function Repository
Instant-use add-on functions for the Wolfram Language
Function Repository Resource:
Calculate the variance of a list along with its uncertainty
ResourceFunction["VarianceAround"][{x1,x2,x3,…}] gives an Around object describing the variance of xi and its uncertainty. |
Calculate the variance of some numbers:
| In[1]:= |
| Out[1]= |
VarianceAround works with symbolic expressions:
| In[2]:= |
| Out[2]= | 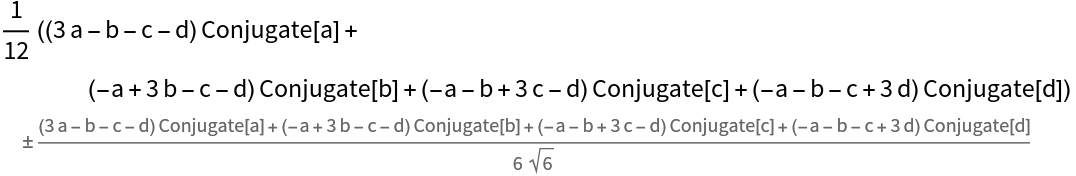 |
VarianceAround also works with quantities with units:
| In[3]:= |
| Out[3]= |
VarianceAround applied to symbolic expressions can get unwieldy fast:
| In[4]:= |
| Out[4]= | 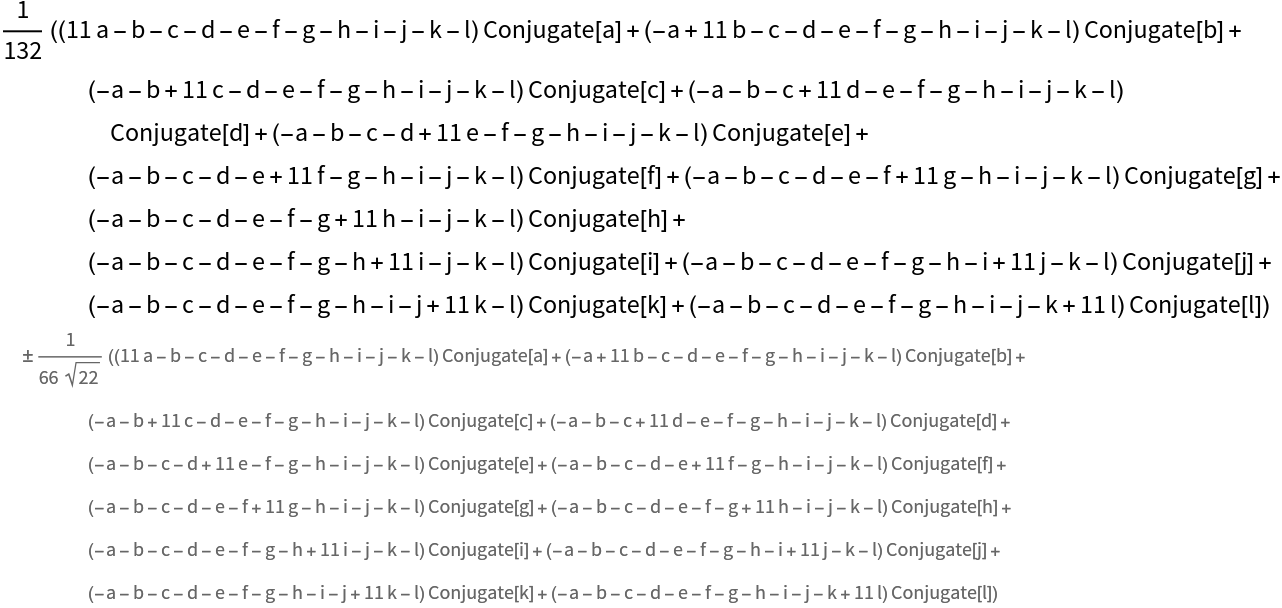 |
The variance can not be calculated for a list with a single element:
| In[5]:= |
| Out[5]= |
Study the variance and its uncertainty for a sequence of values and compare it to the theoretical value of the distribution:
| In[6]:= | ![SeedRandom[3];
dist = NormalDistribution[2, 3];
vals = RandomVariate[dist, 10^6];
values = Table[{n, ResourceFunction["VarianceAround"][vals[[;; n]]]}, {n, Round[10^Range[2, 6, 1/8]]}];
ListLogLinearPlot[values, PlotRange -> {6, 12}, GridLines -> {{}, {Variance[dist]}}, GridLinesStyle -> Dashed, AxesLabel -> {"Number of values", "Estimate of the variance"}, ImageSize -> 500]](https://www.wolframcloud.com/obj/resourcesystem/images/42b/42bc9d2f-0445-4bec-9802-6e46225c4c78/4f6cbe0871d5091f.png) |
| Out[10]= | 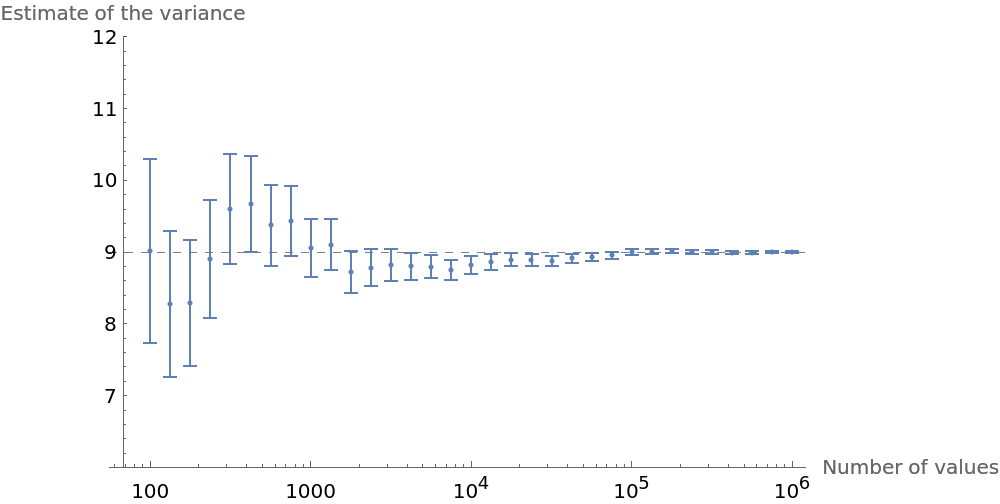 |
This work is licensed under a Creative Commons Attribution 4.0 International License