Wolfram Function Repository
Instant-use add-on functions for the Wolfram Language
Function Repository Resource:
Get a number line diagram with information about where a function is positive, negative, zero or discontinuous
ResourceFunction["SignChart"][expr, x] creates a number line diagram with information about the sign of the real univariate function expr, written in terms of the variable x. |
| FontSize | Medium | the font size of sign chart labels |
| "PlusColor" | the color corresponding to positive points/intervals | |
| "MinusColor" | the color corresponding to negative points/intervals | |
| "ZeroColor" | the color corresponding to zero or discontinuous points/intervals | |
| Tooltip | True | whether to include tooltips corresponding to critical values |
Get a sign chart for 2x-10, which is negative for x<5, zero at x=5 and positive for x>5:
| In[1]:= |
| Out[1]= | 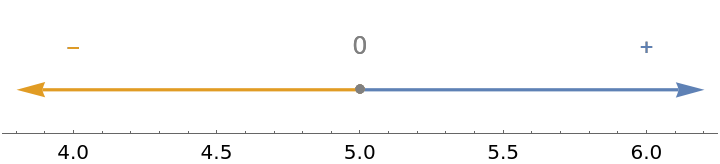 |
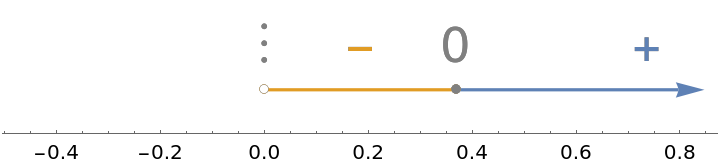
Discontinuities are indicated on the sign chart with vertical dots:
| In[2]:= |
| Out[2]= | 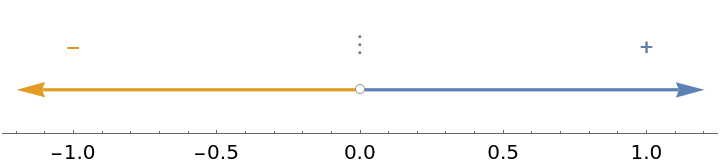 |
Use the option "MinusColor" to adjust the color of the negative intervals and minus signs:
| In[4]:= |
| Out[4]= | 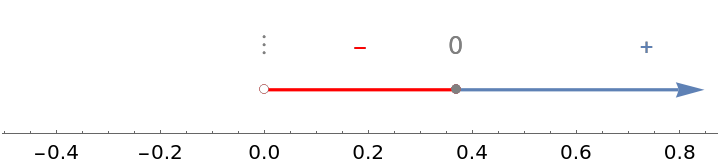 |
Use the option "PlusColor" to adjust the color of the positive intervals and plus signs:
| In[5]:= |
| Out[5]= | 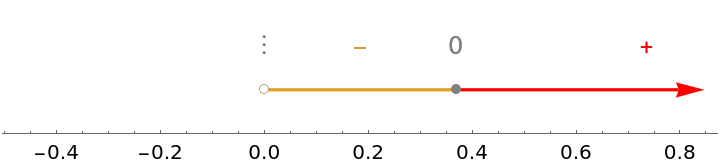 |
Use the option "ZeroColor" to adjust the color of the zero or discontinuous intervals and zeros:
| In[6]:= |
| Out[6]= | 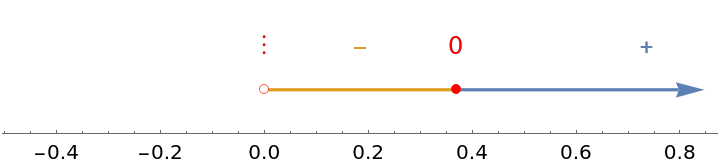 |
Sign charts are a useful reasoning tool in many contexts, especially calculus functional analysis. For example, compare the plot of a function to the sign chart of the function's derivative to visualize the first derivative test:
| In[7]:= | ![With[{poly = (x + 3) (x - 1) (x + 1) (x + 2)}, Column[{
Plot[poly, {x, -4, 2}, PlotRange -> {{-4, 2}, {-10, 10}}],
ResourceFunction["SignChart"][D[poly, x], x]
}]]](https://www.wolframcloud.com/obj/resourcesystem/images/1d0/1d0952c3-edc9-4e60-bc91-4e740837c666/7002d247e004064a.png) |
| Out[7]= | 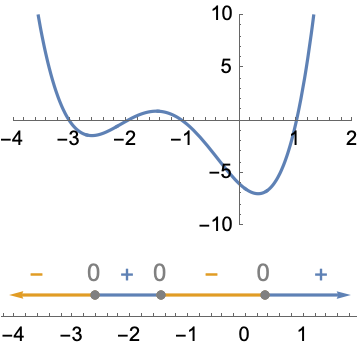 |
If there are infinitely many places where a function changes signs, the sign chart displays information for an interval surrounding x=0:
| In[8]:= |
| Out[8]= | 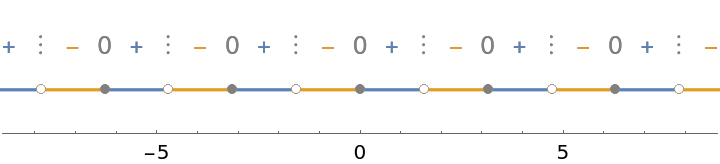 |
To view the full source code for SignChart, evaluate the following:

This work is licensed under a Creative Commons Attribution 4.0 International License