Wolfram Language Paclet Repository

Community-contributed installable additions to the Wolfram Language

Primary Navigation

    • Cloud & Deployment
    • Core Language & Structure
    • Data Manipulation & Analysis
    • Engineering Data & Computation
    • External Interfaces & Connections
    • Financial Data & Computation
    • Geographic Data & Computation
    • Geometry
    • Graphs & Networks
    • Higher Mathematical Computation
    • Images
    • Knowledge Representation & Natural Language
    • Machine Learning
    • Notebook Documents & Presentation
    • Scientific and Medical Data & Computation
    • Social, Cultural & Linguistic Data
    • Strings & Text
    • Symbolic & Numeric Computation
    • System Operation & Setup
    • Time-Related Computation
    • User Interface Construction
    • Visualization & Graphics
    • Random Paclet
    • Alphabetical List
  • Using Paclets
    • Get Started
    • Download Definition Notebook
  • Learn More about Wolfram Language

DiagrammaticComputation

Guides

  • DiagramConversion
  • DiagramDrawing
  • DiagramGrid
  • DiagramRewriting
  • Diagrams
  • DiagramSurgery
  • FeynmanDiagrams
  • Ports

Tech Notes

  • Diagram Examples
  • Introduction to Diagrammatic Computation
  • Rewriting Diagrams

Symbols

  • AnnihilationRule
  • CapDiagram
  • ColumnDiagram
  • CommutationRule
  • CopyDiagram
  • CupDiagram
  • DiagramArrange
  • DiagramAssignPorts
  • DiagramCases
  • DiagramComposition
  • DiagramCopySplit
  • DiagramDecompose
  • DiagramDelete
  • DiagramDraw
  • DiagramDual
  • DiagramExpressionReplace
  • DiagramExtract
  • DiagramFlip
  • DiagramFunction
  • DiagramGraphics
  • DiagramGraphSimplify
  • DiagramGridHeight
  • DiagramGrid
  • DiagramGridTree
  • DiagramGridWidthHeight
  • DiagramGridWidth
  • DiagramHypergraph
  • DiagramHypergraphRule
  • DiagramInsert
  • DiagramMapAt
  • DiagramMap
  • DiagramMatchPorts
  • Diagram
  • DiagramNestReplace
  • DiagramNetwork
  • DiagramPattern
  • DiagramPermute
  • DiagramPosition
  • DiagramPositions
  • DiagramProduct
  • DiagramQ
  • DiagramReplaceList
  • DiagramReplace
  • DiagramReplacePart
  • DiagramReverse
  • DiagramRightComposition
  • DiagramRule
  • DiagramsFreePorts
  • DiagramsGraph
  • DiagramsNetGraph
  • DiagramSplit
  • DiagramsPortGraph
  • DiagramSubdiagrams
  • DiagramSum
  • DiagramTensor
  • DuplicateAnnihilationRule
  • DuplicateEraserRule
  • EmptyDiagram
  • EmptyDiagramQ
  • EmptyPortQ
  • EraserAnnihilationRule
  • EraserDiagram
  • EraserRule
  • FeynArtsTopologyGraphics
  • FeynmanDiagram
  • GridInputPorts
  • GridOutputPorts
  • IdentityDiagram
  • MergeDiagram
  • PermutationDiagram
  • PortDual
  • PortMinus
  • Port
  • PortNeutral
  • PortPower
  • PortProduct
  • PortQ
  • PortSum
  • PropagationRule
  • RemoveDiagramRule
  • RowDiagram
  • SimplifyDiagram
  • SingletonDiagram
  • SpiderDiagram
  • TagPort
  • TensorDiagram
  • ToDiagram
  • ToDiagramNetwork
  • TopologyGraphics
  • TopologyGraph
  • TopologyGraphs
  • UntagPort
  • WigglyArcFunction
  • ZeroDiagram
  • ZeroPortQ
Diagram Examples
A gallery of worked examples: modeling a recipe as a dataflow diagram, building sorting networks from permutations, round-tripping between diagrams and symbolic tensors, and viewing trees and graphs as diagram grids.
In[1]:=
<<Wolfram`DiagrammaticComputation`
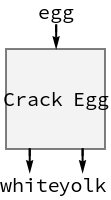
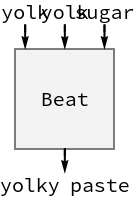
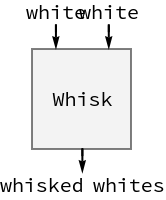
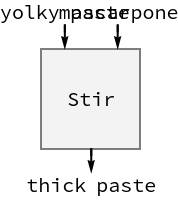
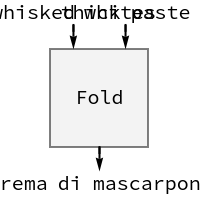
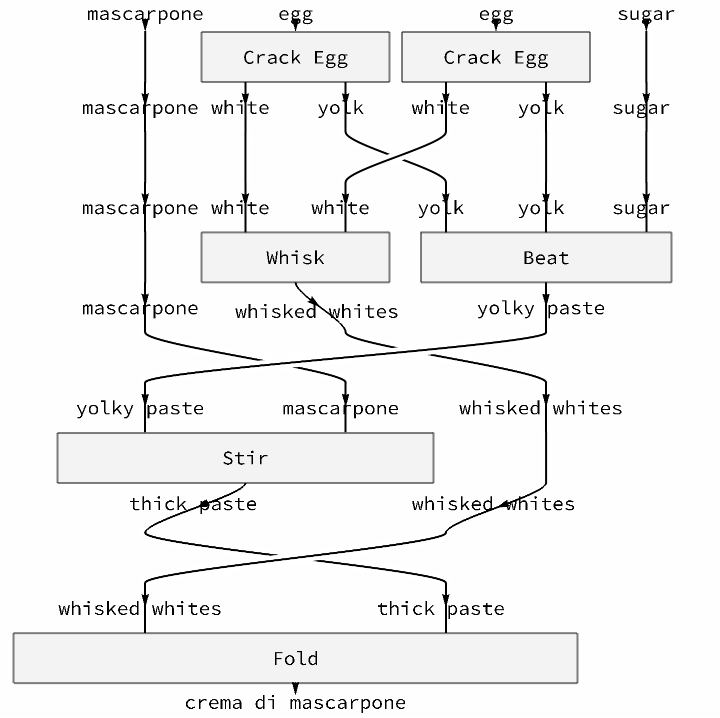
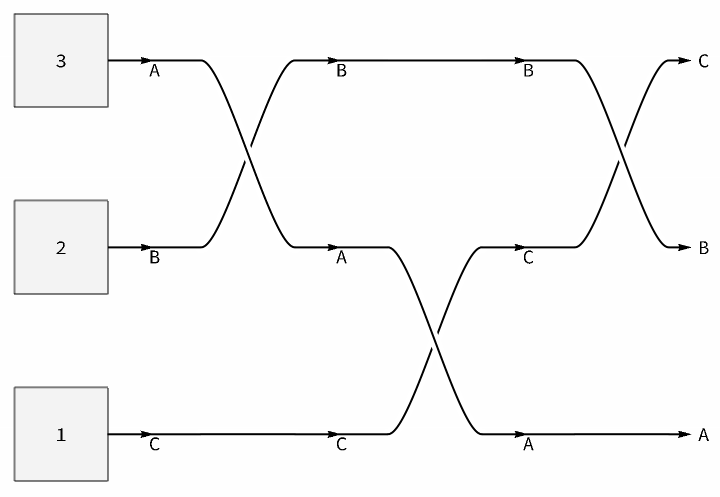
A Recipe as a Dataflow
Any process whose steps consume and produce named resources is a diagram. The classic tiramisu cream:
In[2]:=
​​egg=
Diagram
["Crack Egg","egg",{"white","yolk"}],​​beat=
Diagram
["Beat",{"yolk","yolk","sugar"},"yolky paste"],​​whisk=
Diagram
["Whisk",{"white","white"},"whisked whites"],​​stir=
Diagram
["Stir",{"yolky paste","mascarpone"},"thick paste"],​​fold=
Diagram
["Fold",{"whisked whites","thick paste"},"crema di mascarpone"]​​
Out[2]=

,
,
,
,

Stack the steps with
ColumnDiagram
and
RowDiagram
; matching resource names wire automatically:
In[3]:=
ColumnDiagram
​​
RowDiagram
egg,egg,
IdentityDiagram
["sugar"],​​
RowDiagram
[{whisk,beat}],​​stir,​​fold​​
Out[3]=
Sorting Networks
A bubble sort is a stack of adjacent transpositions. Start from an unsorted row of labelled wires:
In[4]:=
init=
RowDiagram
MapIndexed
Diagram
[#2〚1〛,#1]&,{C,B,A}
Out[4]=
Each comparison-swap is a
PermutationDiagram
:
In[5]:=
PermutationDiagram
[{B,A}{A,B}]
Out[5]=
Stacking the three swaps sorts the wires:
In[6]:=
sortNetwork=
ColumnDiagram
​​init,​​
PermutationDiagram
[{B,A}{A,B}],​​
PermutationDiagram
[{C,A}{A,C}],​​
PermutationDiagram
[{C,B}{B,C}]​​,"Rotate"Pi2
Out[6]=
Since the network is nothing but wires,
SimplifyDiagram
contracts it to the overall permutation:
In[7]:=
SimplifyDiagram

ColumnDiagram
​​
PermutationDiagram
[{B,A}{A,B}],​​
PermutationDiagram
[{C,A}{A,C}],​​
PermutationDiagram
[{C,B}{B,C}]​​
Out[7]=
Diagrams and Tensors
A composition of symbolic processes reads directly as matrix algebra. The
"Tensor"
property of a diagram extracts the contraction:
In[8]:=
ColumnDiagram

Diagram
[A,a,b],
Diagram
[B,b,c],
Diagram
[C,c,d]["Tensor"]
Out[8]=
ArrayDotArrayDot
⥎
C
,
⥎
B
,1,
⥎
A
,1
In the other direction,
TensorDiagram
turns a tensor expression into a diagram. A contraction of two arrays over two indices:
In[9]:=
TensorDiagram
[ArrayDot[ArraySymbol[A,{6,5,2,3}],ArraySymbol[B,{2,3,4}],2]]
Out[9]=
The round trip preserves the network:
In[10]:=
d1=
DiagramNetwork

Diagram
[A,a,b],
Diagram
[B,b,a]
Out[10]=
Diagrams whose labels carry concrete arrays evaluate numerically:
Trees and Graphs as Grids
A graph becomes a network of vertex diagrams joined along its edges:
The network's grid arrangement introduces the necessary caps, cups and crossings automatically:
Executable Dataflow with Parallelism
Annotated diagrams run as functions (see the introduction tech note). Functions in independent branches can run on parallel kernels:

© 2026 Wolfram. All rights reserved.

  • Legal & Privacy Policy
  • Contact Us
  • WolframAlpha.com
  • WolframCloud.com