Wolfram Function Repository
Instant-use add-on functions for the Wolfram Language
Function Repository Resource:
Bootstrap a single statistic or a list of statistics
| ResourceFunction["BootstrapStatistics"][data,n] returns a list of n bootstrapped datasets. | |
| ResourceFunction["BootstrapStatistics"][data,n,func] returns a list of the values of func applied to n bootstrapped datasets. | |
| ResourceFunction["BootstrapStatistics"][data,n,funclist] returns a list each function in funclist applied to n bootstrapped datasets. | 
Create five bootstrapped datasets by resampling from an original dataset:
| In[1]:= | ![ResourceFunction["BootstrapStatistics"][{1, 2, 3, 4, 5, 6}, 5]](https://www.wolframcloud.com/obj/resourcesystem/images/ed5/ed5a5aac-1a53-4c30-82b5-57aa0c378343/3bfdc3b3368c669a.png) | 
| Out[1]= |  | 
Compute the Mean of a dataset:
| In[2]:= | ![Mean[{1, 2, 3, 4, 5, 6}]](https://www.wolframcloud.com/obj/resourcesystem/images/ed5/ed5a5aac-1a53-4c30-82b5-57aa0c378343/1485c2da90a269be.png) | 
| Out[2]= |  | 
Compare it to the means of ten bootstrapped samples:
| In[3]:= | ![samplemeans = ResourceFunction["BootstrapStatistics"][{1, 2, 3, 4, 5, 6}, 100, Mean]](https://www.wolframcloud.com/obj/resourcesystem/images/ed5/ed5a5aac-1a53-4c30-82b5-57aa0c378343/523294ee35511a18.png) | 
| Out[3]= |  | 
| In[4]:= | ![Histogram[samplemeans]](https://www.wolframcloud.com/obj/resourcesystem/images/ed5/ed5a5aac-1a53-4c30-82b5-57aa0c378343/5957ec0f832e142e.png) | 
| Out[4]= |  | 
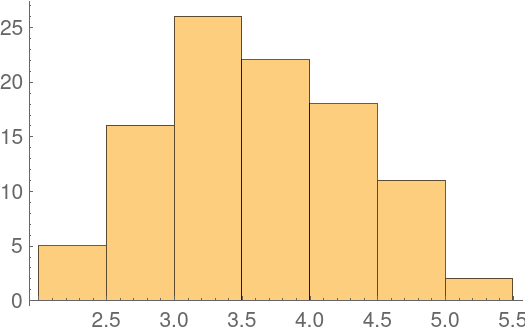
Pass a list of functions to BootstrapStatistics to get a list of lists of results:
| In[5]:= | ![ResourceFunction[
 "BootstrapStatistics"][{1, 2, 3, 4, 5, 6}, 5, {Mean, Median, StandardDeviation, Variance}]](https://www.wolframcloud.com/obj/resourcesystem/images/ed5/ed5a5aac-1a53-4c30-82b5-57aa0c378343/626fc0b854ca92d3.png) | 
| Out[5]= |  | 
The example dataset "BuffaloSnow" shows snowfall records for Buffalo, New York:
| In[6]:= | ![ExampleData[{"Statistics", "BuffaloSnow"}, "Description"]](https://www.wolframcloud.com/obj/resourcesystem/images/ed5/ed5a5aac-1a53-4c30-82b5-57aa0c378343/394c23c4f684bb72.png) | 
| Out[6]= |  | 
With traditional methods, we can only get one estimate for the mean snowfall:
| In[7]:= | ![snowdata = ExampleData[{"Statistics", "BuffaloSnow"}];
Mean[snowdata]](https://www.wolframcloud.com/obj/resourcesystem/images/ed5/ed5a5aac-1a53-4c30-82b5-57aa0c378343/612f70da98791c86.png) | 
| Out[8]= |  | 
Using the bootstrap method, we can get a larger set giving us a better idea of how much this measure varies:
| In[9]:= | ![snowmeans = ResourceFunction["BootstrapStatistics"][snowdata, 10000, Mean];
Histogram[snowmeans]](https://www.wolframcloud.com/obj/resourcesystem/images/ed5/ed5a5aac-1a53-4c30-82b5-57aa0c378343/4d5238c3df9ac707.png) | 
| Out[10]= |  | 
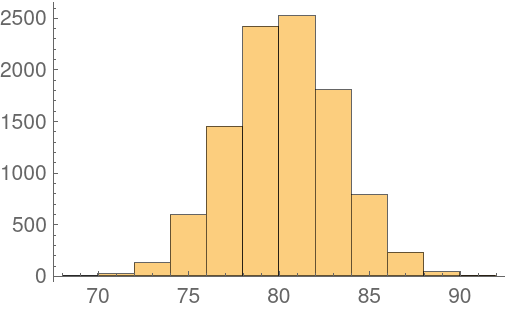
We can use Quantile to find the 95% confidence interval:
| In[11]:= | ![Quantile[snowmeans, {0.025, 0.975}]](https://www.wolframcloud.com/obj/resourcesystem/images/ed5/ed5a5aac-1a53-4c30-82b5-57aa0c378343/4c2df244d9e9923d.png) | 
| Out[11]= |  | 
This work is licensed under a Creative Commons Attribution 4.0 International License