Wolfram Function Repository
Instant-use add-on functions for the Wolfram Language
Function Repository Resource:
Visualize the function evaluations done by FindRoot
ResourceFunction["FindRootPlot"][f,{x,xst}] plots the steps and the points at which the function f and any of its derivatives are evaluated in FindRoot[f,{x,xst}], superimposed on a plot of f versus x. | |
ResourceFunction["FindRootPlot"][{f1,f2},{{x,xst},{y,yst}}] plots the steps and the points at which the pair of functions and their derivatives are evaluated, superimposed on a contour plot of the merit function. | |
ResourceFunction["FindRootPlot"][f,range,property] returns the specified property. |
| "Result" | the result of FindRoot |
| "Statistics" | an association showing the number of steps and evaluations of the function and its derivatives |
| "Plot" | the plot of the function and the evaluation points |
| All | association containing "Result", "Statistics" and "Plot" |
| "EvaluationStyles" | Automatic | styles used for the evaluation points |
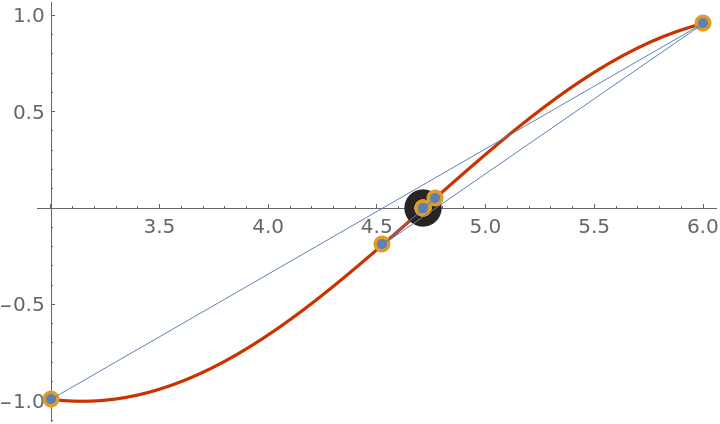
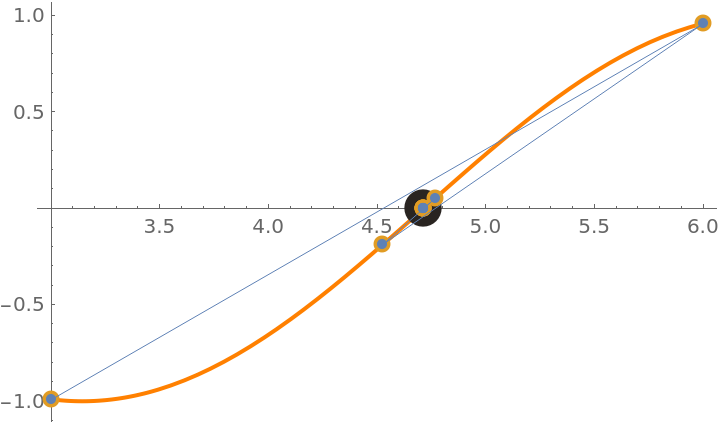
Show the steps and function evaluations used in finding the root of cos(x)=0:
| In[1]:= |
|
| Out[1]= |
|
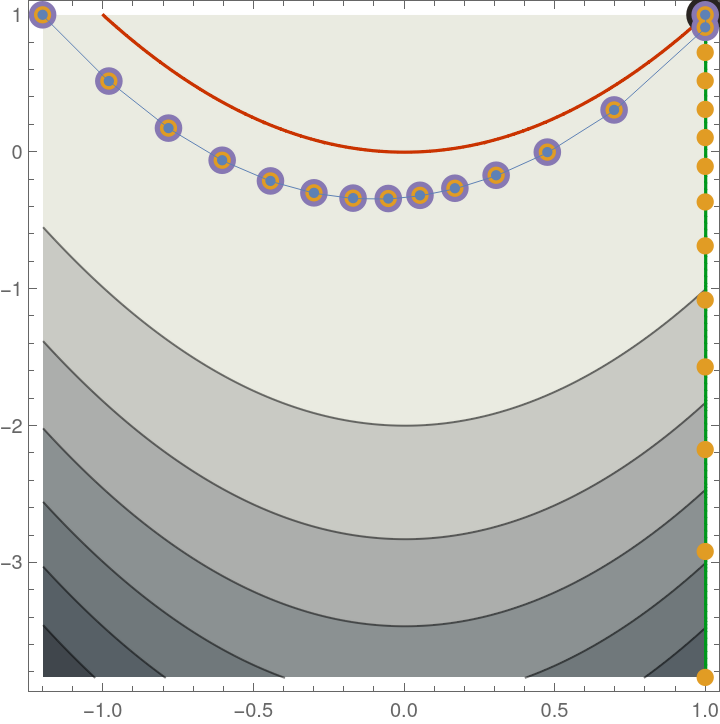
Show the steps and function evaluations used in finding the root of the Rosenbrock problem 1-x=0,10(y-x2)=0:
| In[2]:= |
|
| Out[2]= |
|
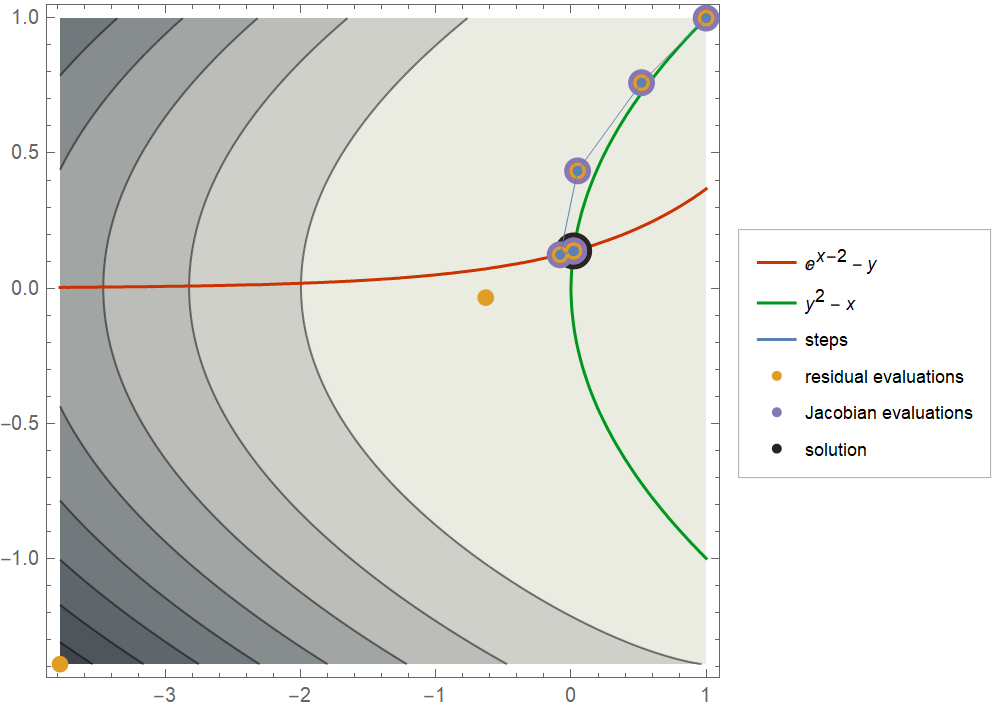
Use PlotLegends to display a legend for the evaluation points:
| In[3]:= |
|
| Out[3]= |
|
Use a different rootfinding method from the default:
| In[4]:= |
|
| Out[4]= |
|
Return the statistics of the evaluations done by FindRoot:
| In[5]:= |
|
| Out[5]= |
|
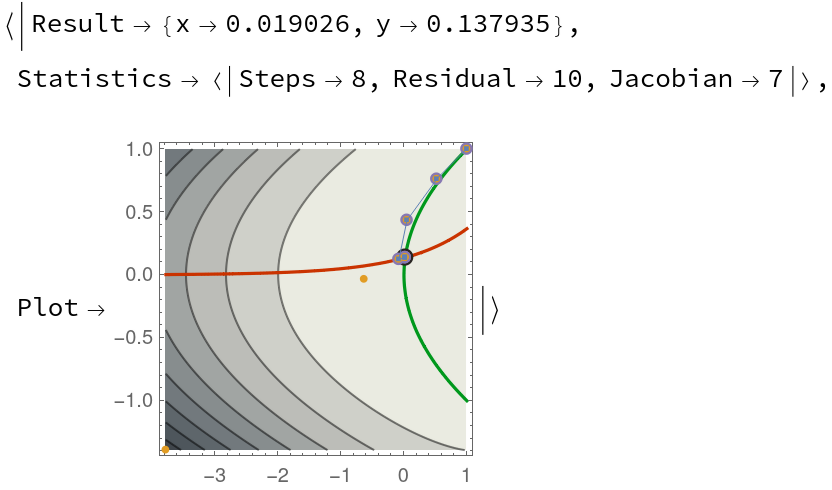
Return all properties:
| In[6]:= |
|
| Out[6]= |
|
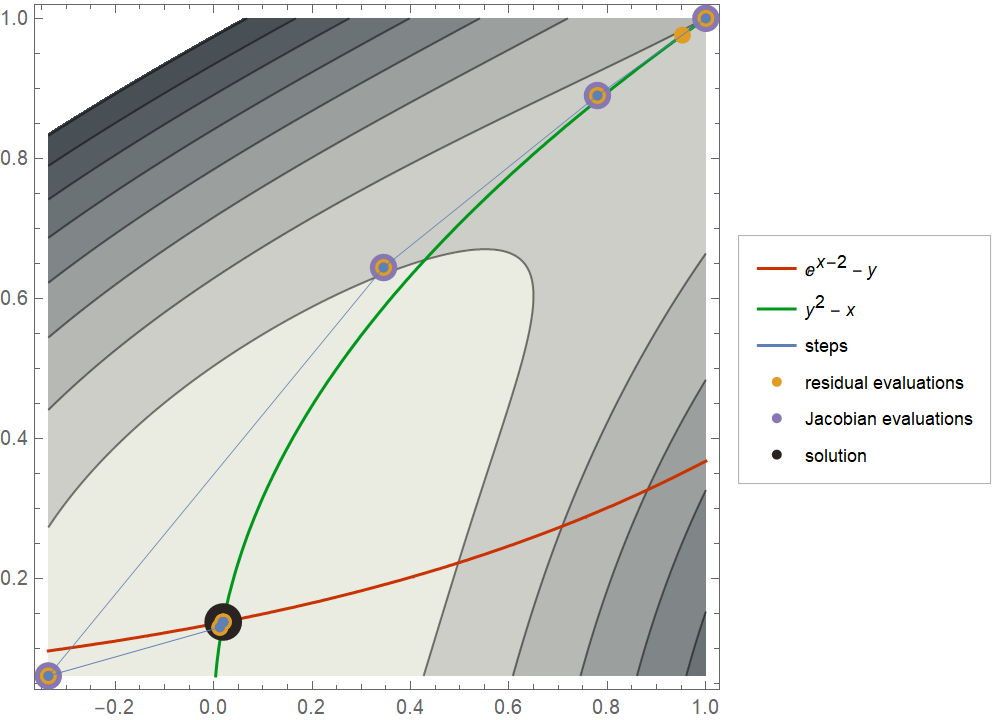
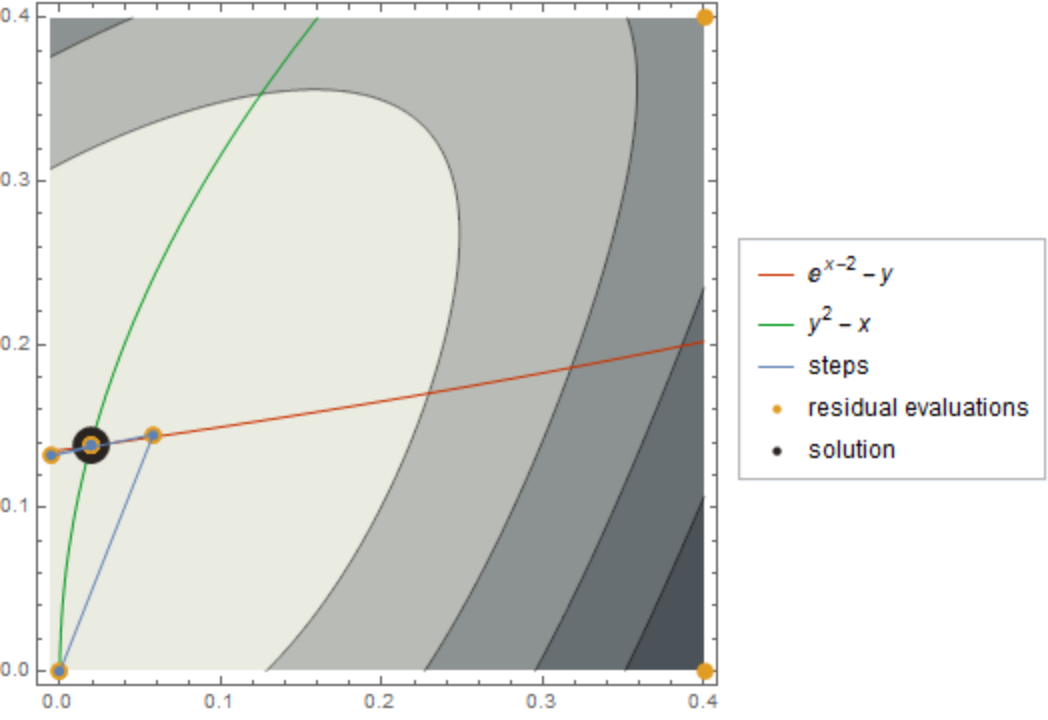
Use "EvaluationStyles" to change the style used for the evaluation points:
| In[8]:= |
![ResourceFunction[
"FindRootPlot"][{Exp[x - 2] - y, y^2 - x}, {{x, 1.}, {y, 1.}}, "EvaluationStyles" -> <|{"Steps" -> Directive[Blue, Thin, PointSize[0.015]], "Residual" -> Directive[Yellow, PointSize[0.025]], "Jacobian" -> Directive[Purple, PointSize[0.04]], "Solution" -> PointSize[0.055]}|>, PlotLegends -> Automatic]](https://www.wolframcloud.com/obj/resourcesystem/images/ea2/ea2145e4-fbca-4cbf-8eed-908bd6cc57cf/36f0ac747c181c5d.png)
|
| Out[8]= |

|
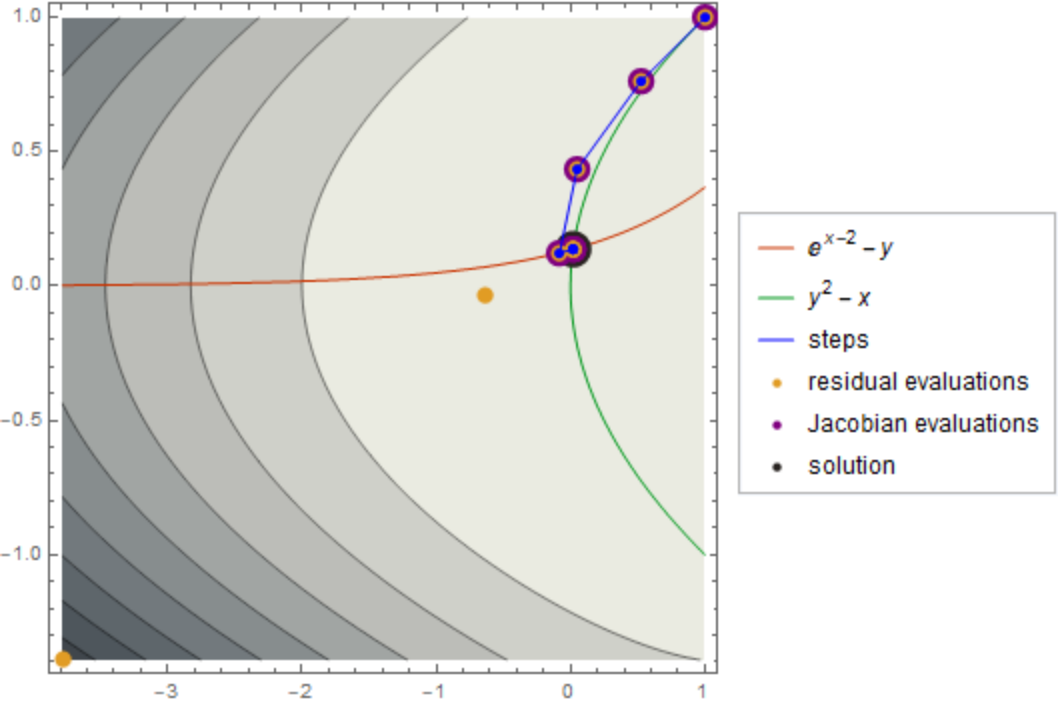
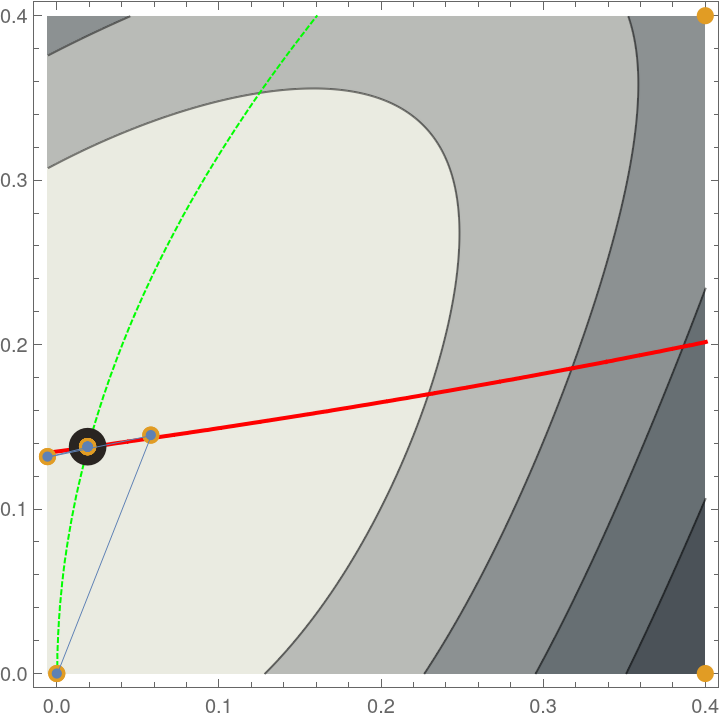
Default styles are used if a particular style is left unspecified:
| In[9]:= |
![ResourceFunction[
"FindRootPlot"][{Exp[x - 2] - y, y^2 - x}, {{x, 1.}, {y, 1.}}, "EvaluationStyles" -> <|{"Steps" -> Directive[Blue, Thin, PointSize[0.015]], "Jacobian" -> Directive[Purple, PointSize[0.04]]}|>, PlotLegends -> Automatic]](https://www.wolframcloud.com/obj/resourcesystem/images/ea2/ea2145e4-fbca-4cbf-8eed-908bd6cc57cf/15a5b8a1704408f4.png)
|
| Out[9]= |
|
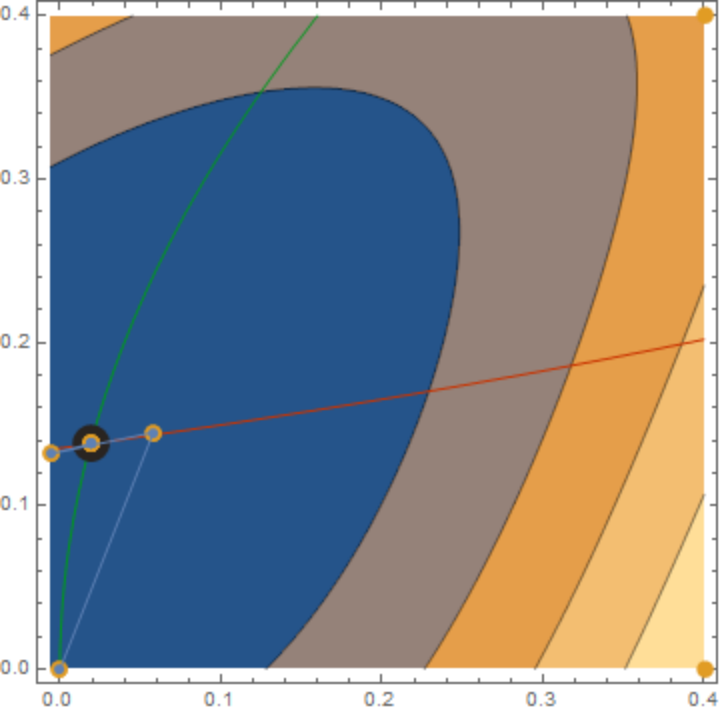
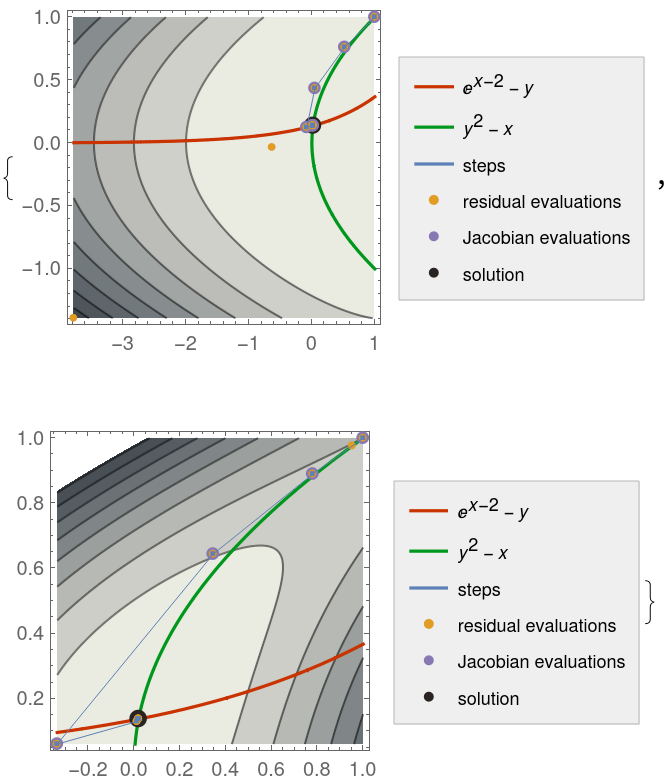
Compare different rootfinding methods:
| In[10]:= |
![{ResourceFunction[
"FindRootPlot"][{Exp[x - 2] - y, y^2 - x}, {{x, 1}, {y, 1}}, Method -> "Newton", PlotLegends -> Automatic], ResourceFunction[
"FindRootPlot"][{Exp[x - 2] - y, y^2 - x}, {{x, 1}, {y, 1}}, Method -> "AffineCovariantNewton", PlotLegends -> Automatic]}](https://www.wolframcloud.com/obj/resourcesystem/images/ea2/ea2145e4-fbca-4cbf-8eed-908bd6cc57cf/3e91d23bbd33c16b.png)
|
| Out[10]= |
|
Show a legend for the evaluation points:
| In[11]:= |
|
| Out[11]= |
|
Change the style used for the functions:
| In[12]:= |
|
| Out[12]= |
|
| In[13]:= |
|
| Out[13]= |
|
This work is licensed under a Creative Commons Attribution 4.0 International License