Wolfram Function Repository
Instant-use add-on functions for the Wolfram Language
Function Repository Resource:
Plot a hypergraph defined by a list of hyperedges
ResourceFunction["HypergraphPlot"][{{vi1,vi2,…},…}] generates a plot of the hypergraph with hyperedges {{vi1,vi2,…},…}. |
| "BaseLayout" | "SpringEmbedding" | how to lay out vertices |
| "SubsetBoundary" | Automatic | whether to draw the boundary of subsets |
| "SubsetBoundaryScale" | 2 | scale factor of the subset boundary size |
| "SubsetBoundaryStyle" | Automatic | styles for subsets |
| "SubsetEdge" | Automatic | whether to draw edges connecting vertices in subsets |
| "SubsetEdgeStyle" | Automatic | styles for subset edges |
| PlotTheme | “NameLabeled" | overall theme for vertices |
| VertexCoordinates | Automatic | center coordinates for vertices |
| VertexLabels | None | labels and placements for vertices |
| VertexLabelStyle | Automatic | style to use for vertex labels |
| VertexShapeFunction | Automatic | generate graphic shapes for vertices |
| VertexSize | 0.15 | size of vertices |
| VertexStyle | Automatic | styles for vertices |
Draw a hypergraph:
| In[1]:= |
| Out[1]= |  |
Draw a hypergraph without edges connecting subsets:
| In[2]:= | ![ResourceFunction[
"HypergraphPlot"][{{1, 2, 3}, {2, 3, 5, 8}, {5, 7, 8}}, "SubsetBoundaryStyle" -> (Directive[Opacity[.5], EdgeForm[Black], #] & /@ ColorData[35, "ColorList"][[{2, 5, 10}]]), "SubsetBoundaryScale" -> {1.8, 2.5, 3}, "SubsetEdge" -> False]](https://www.wolframcloud.com/obj/resourcesystem/images/e9b/e9bc95c7-b561-4aff-a947-8443522e0d42/4b4c24f24a61cc4d.png) |
| Out[2]= | 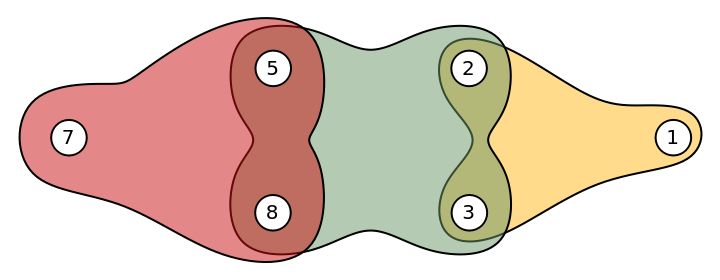 |
Draw a hypergraph with different vertex styles:
| In[3]:= | ![ResourceFunction["HypergraphPlot"][{{1, 2, 3}, {2, 3, 5}, {5, 7, 8}}, "SubsetBoundaryStyle" -> (Directive[Opacity[.5], EdgeForm[Black], #] & /@ ColorData[35, "ColorList"][[{2, 5, 10}]]), "SubsetBoundaryScale" -> {8, 10, 11}, "SubsetEdge" -> False, PlotTheme -> "Detailed", VertexSize -> .05, VertexStyle -> Black]](https://www.wolframcloud.com/obj/resourcesystem/images/e9b/e9bc95c7-b561-4aff-a947-8443522e0d42/13b6d767ec1fa81a.png) |
| Out[3]= | 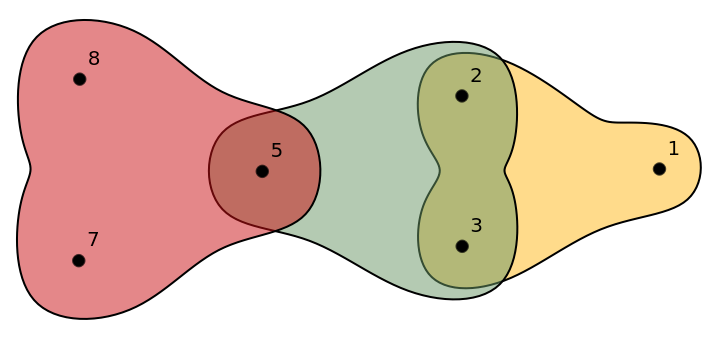 |
The default base layout is "SpringEmbedding":
| In[4]:= |
| Out[4]= |  |
Use "RadialEmbedding":
| In[5]:= |
| Out[5]= | 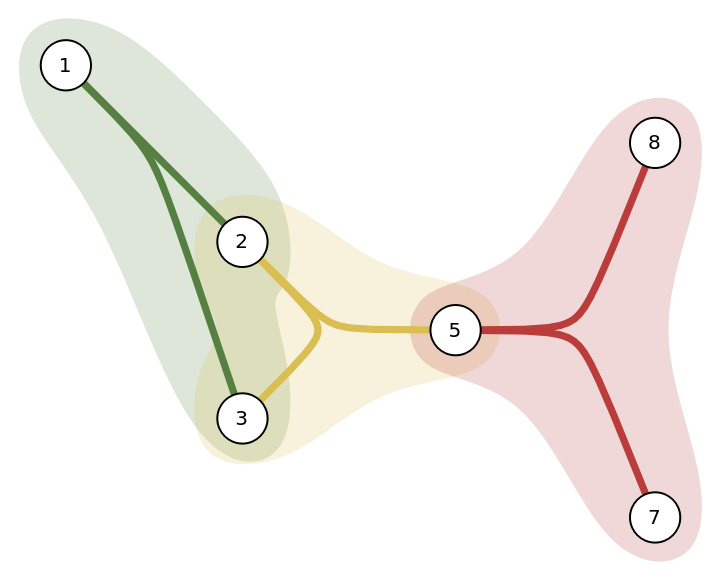 |
The default subset boundary is Automatic:
| In[6]:= |
| Out[6]= |  |
Use False to not show subset boundaries:
| In[7]:= |
| Out[7]= | 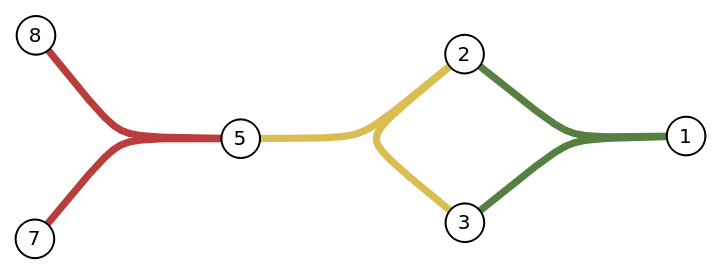 |
Alternate between True and False:
| In[8]:= |
| Out[8]= | 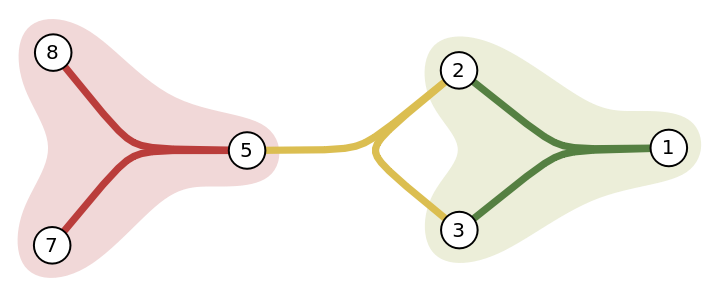 |
The default subset boundary scale factor is 2:
| In[9]:= |
| Out[9]= |  |
Increase the scale factor to 3:
| In[10]:= |
| Out[10]= | 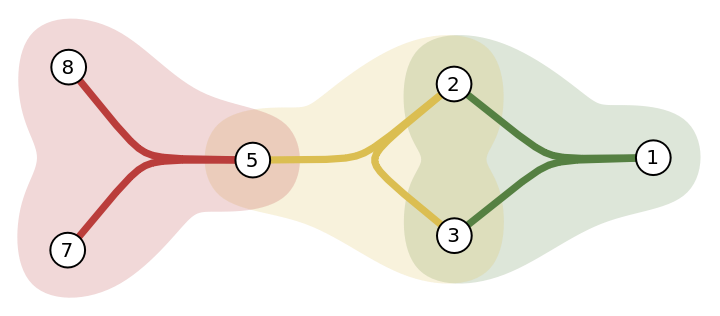 |
Alternate between 3 and 5:
| In[11]:= |
| Out[11]= | 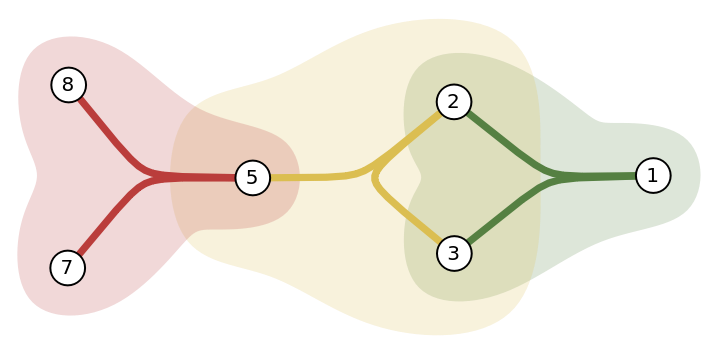 |
The default subset boundary style is Automatic:
| In[12]:= |
| Out[12]= |  |
Use black boundary lines:
| In[13]:= | ![ResourceFunction["HypergraphPlot"][{{1, 2, 3}, {2, 3, 5}, {5, 7, 8}}, "SubsetBoundaryStyle" -> Directive[EdgeForm[Black], FaceForm[]]]](https://www.wolframcloud.com/obj/resourcesystem/images/e9b/e9bc95c7-b561-4aff-a947-8443522e0d42/2c663abba0787c2b.png) |
| Out[13]= |  |
Alternate between red and blue:
| In[14]:= |
| Out[14]= | 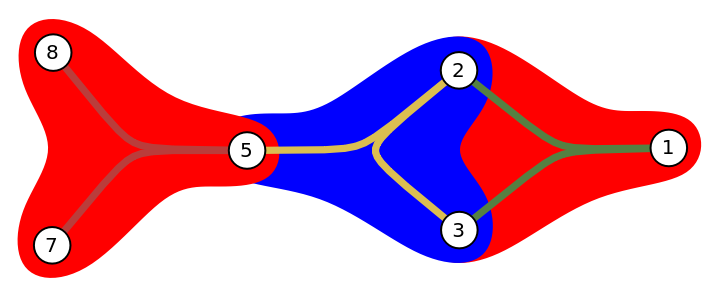 |
The default subset edge is Automatic:
| In[15]:= |
| Out[15]= |  |
Use False to not show subset edges:
| In[16]:= |
| Out[16]= | 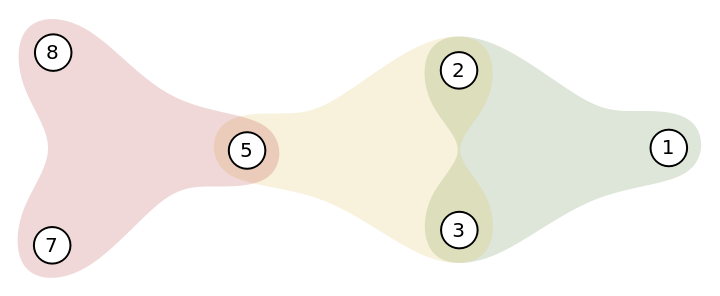 |
Alternate between True and False:
| In[17]:= |
| Out[17]= | 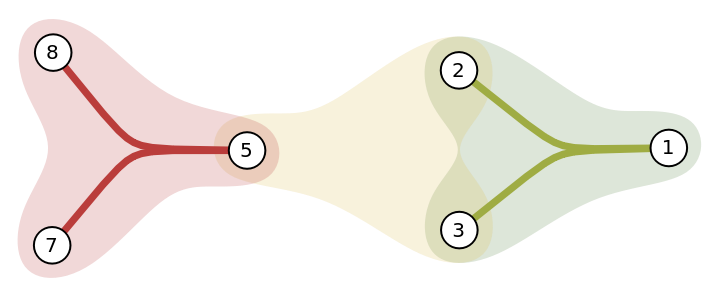 |
The default subset edge style is Automatic:
| In[18]:= |
| Out[18]= |  |
Use black edge lines:
| In[19]:= | ![ResourceFunction["HypergraphPlot"][{{1, 2, 3}, {2, 3, 5}, {5, 7, 8}}, "SubsetEdgeStyle" -> Directive[Thickness[.02], Black]]](https://www.wolframcloud.com/obj/resourcesystem/images/e9b/e9bc95c7-b561-4aff-a947-8443522e0d42/3dcdd0f7b3abb212.png) |
| Out[19]= | 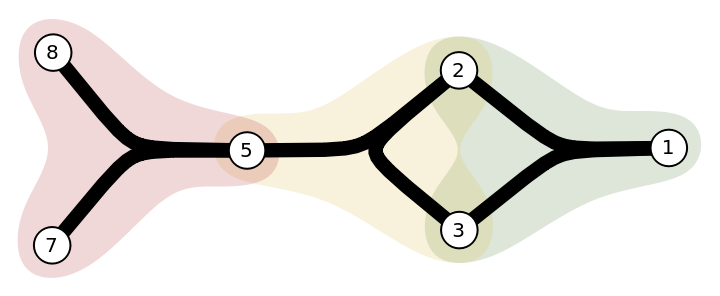 |
Alternate between red and blue:
| In[20]:= |
| Out[20]= | 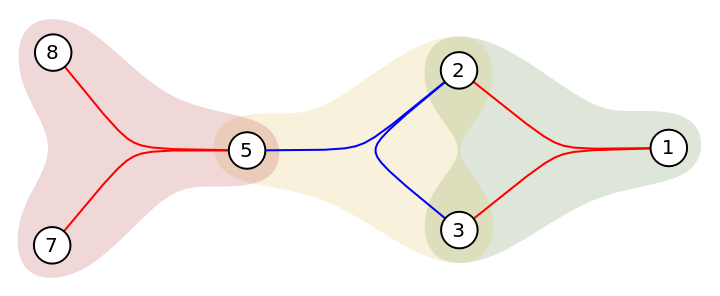 |
Specify vertex coordinates:
| In[21]:= | ![ResourceFunction["HypergraphPlot"][{{1, 2, 3}, {2, 3, 5}, {5, 7, 8}}, VertexCoordinates -> {1 -> {2, 1}, 2 -> {1, 0}, 3 -> {0, 1}, 5 -> {1, 2}, 7 -> {0, 3}, 8 -> {2, 3}}]](https://www.wolframcloud.com/obj/resourcesystem/images/e9b/e9bc95c7-b561-4aff-a947-8443522e0d42/23a779861b0b4138.png) |
| Out[21]= | 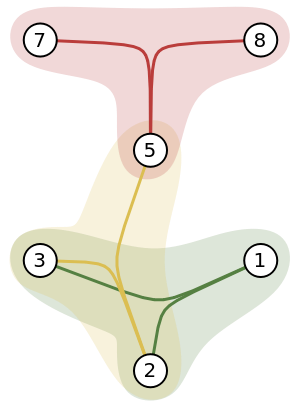 |
Draw a hypergraph constructed by communities:
| In[22]:= | ![ResourceFunction["HypergraphPlot"][
FindGraphCommunities[
ExampleData[{"NetworkGraph", "DolphinSocialNetwork"}]], VertexShapeFunction -> "Capsule", VertexSize -> 0.2]](https://www.wolframcloud.com/obj/resourcesystem/images/e9b/e9bc95c7-b561-4aff-a947-8443522e0d42/7e4f1aa908641d33.png) |
| Out[22]= | 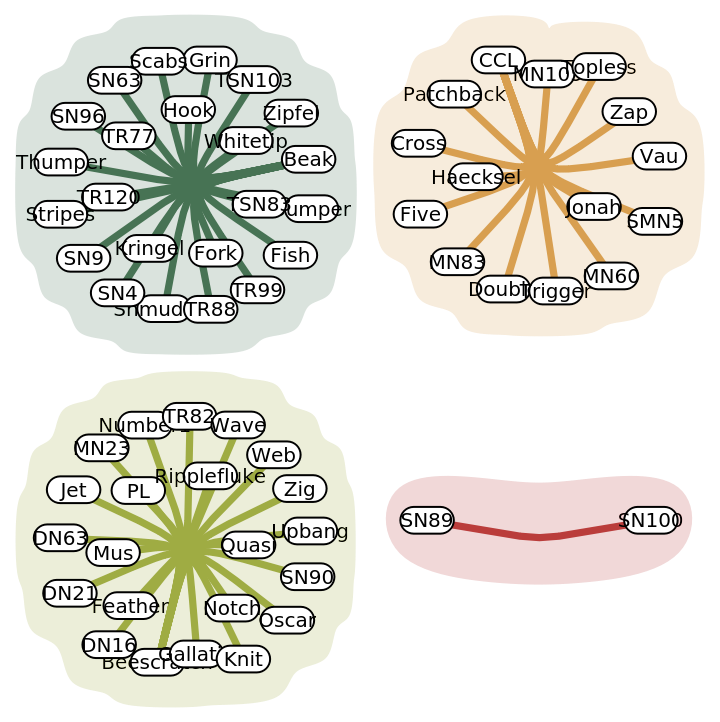 |
Pick the two most involved members of the terrorist network:
| In[23]:= |
| Out[23]= | 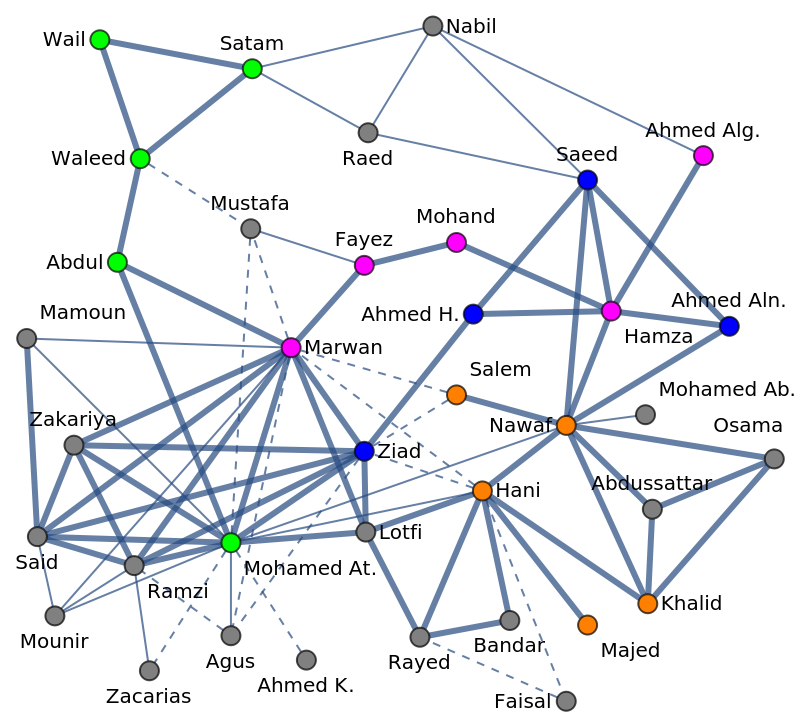 |
| In[24]:= |
| Out[24]= |
Generate a hypergraph by members connected to most involved members:
| In[25]:= |
| Out[25]= |  |
Show a hypergraph:
| In[26]:= |
| Out[26]= | 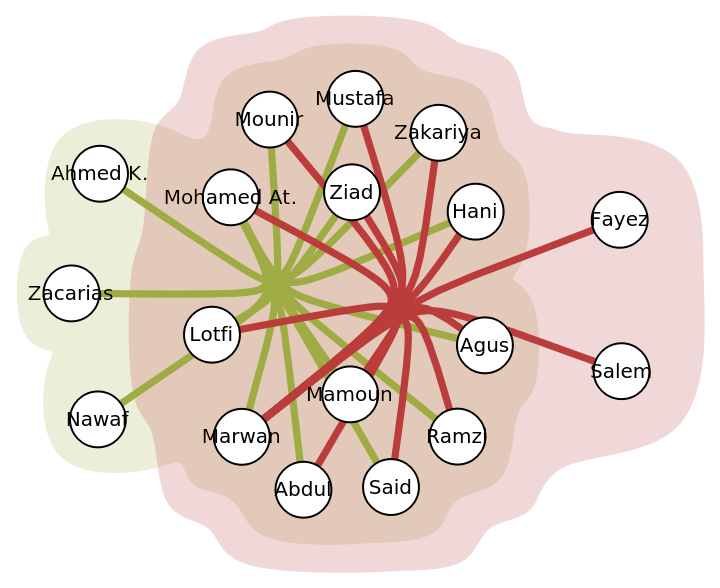 |
This work is licensed under a Creative Commons Attribution 4.0 International License