Wolfram Function Repository
Instant-use add-on functions for the Wolfram Language
Function Repository Resource:
Generate a visual display of a hypergraph
ResourceFunction["WolframModelPlot"][g] generates a plot of the hypergraph g. | |
ResourceFunction["WolframModelPlot"][{g1,g2,…}] generates a list of plots of the hypergraphs gi. | |
ResourceFunction["WolframModelPlot"][data,"type"] generates plots assuming hypergraphs of the specified type. |
| "Ordered" | every hyperedge is interpreted as a sequence of directed edges of adjacent vertices |
| "Cyclic" | the same as "Ordered", with an addition of a directed edge from the last vertex to the first |
| "ArrowheadLength" | Automatic | the length of arrowheads |
| "EdgePolygonStyle" | Automatic | style for hyperedge polygons |
| "HyperedgeRendering" | "Polygons" | how to render hyperedges in the hypergraph |
| "MaxImageSize" | Automatic | upper limit for the image size |
| EdgeStyle | Automatic | style for edges |
| GraphHighlight | {} | vertices and hyperedges to highlight |
| GraphHighlightStyle | Red | highlight color |
| PlotStyle | Automatic | overall style |
| VertexCoordinates | {} | coordinates specified for particular vertices |
| VertexLabels | None | labels for vertices |
| VertexSize | 0.06 | the size of vertices |
| VertexStyle | Automatic | style for vertices |
| "Subgraphs" | render hyperedges as ordinary graphs | 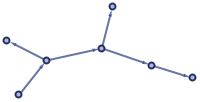 |
| "Polygons" | render hyperedges as polygons |
Plot a hypergraph:
| In[1]:= |
| Out[1]= | 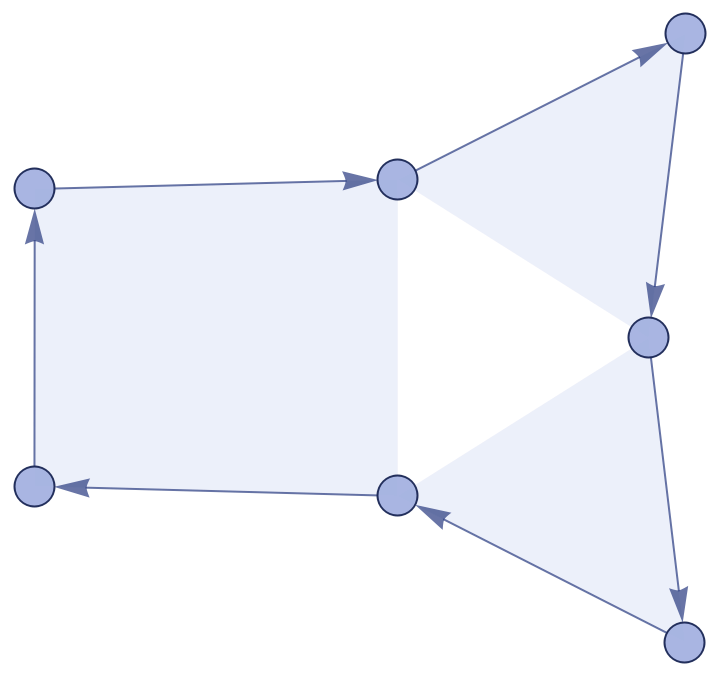 |
Plot a cyclic hypergraph:
| In[2]:= |
| Out[2]= | 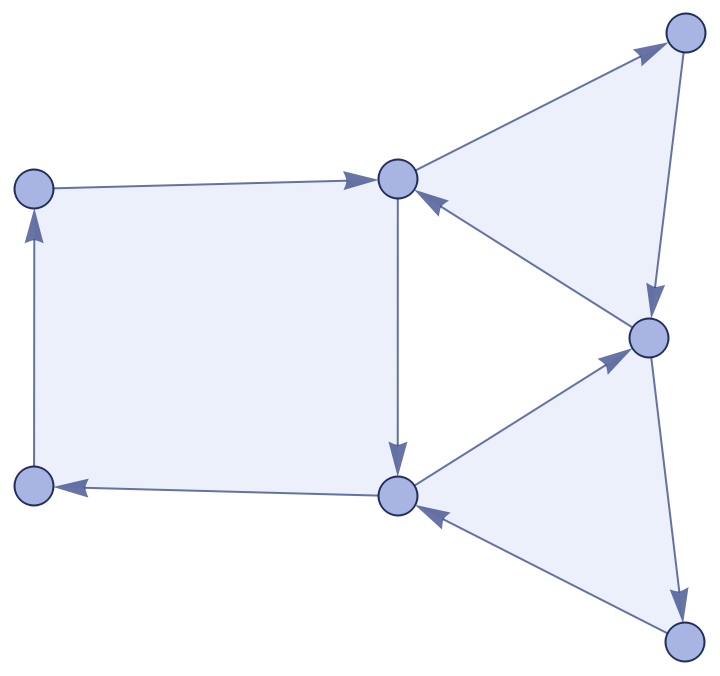 |
Unary edges are shown as circles around the vertices:
| In[3]:= |
| Out[3]= | 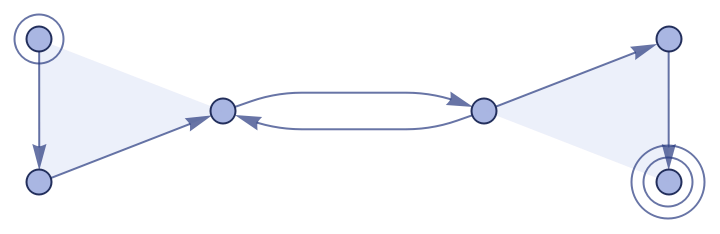 |
Self-loops are shown as convex polygons around the appropriate number of circular arrows:
| In[4]:= |
| Out[4]= | 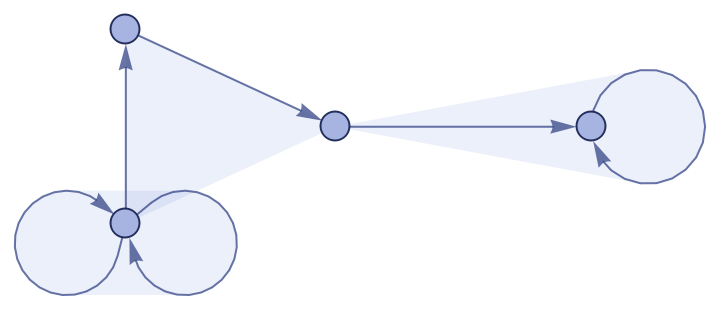 |
Note the difference between a hyper-self-loop and two binary edges pointing in opposite directions:
| In[5]:= |
| Out[5]= |
Multiedges are shown as multiple arrows and polygons:
| In[6]:= |
| Out[6]= | 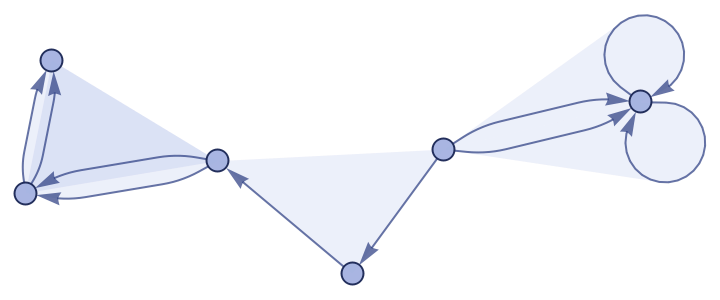 |
Highlight some vertices and edges:
| In[7]:= |
| Out[7]= | 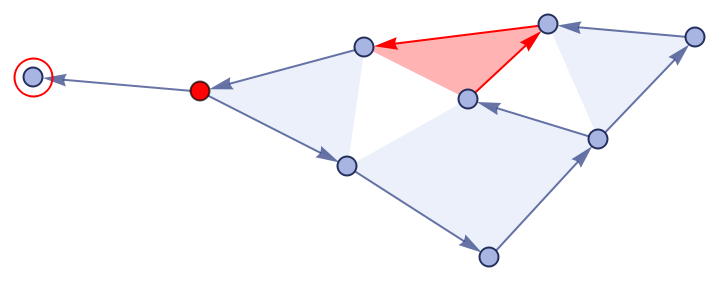 |
Change the color of the highlight:
| In[8]:= |
| Out[8]= | 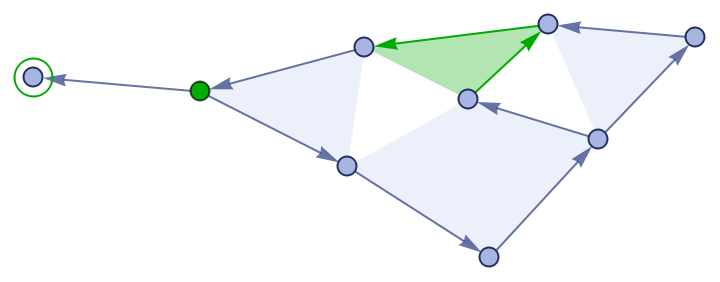 |
Unroll each hypergraph to a sequence of binary edges:
| In[9]:= |
| Out[9]= | 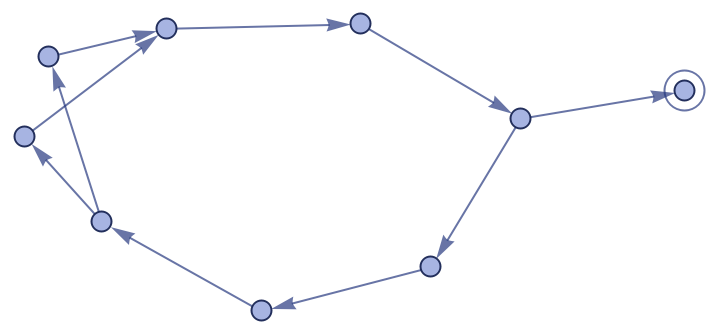 |
Specify custom coordinates for the vertices:
| In[10]:= |
| Out[10]= | 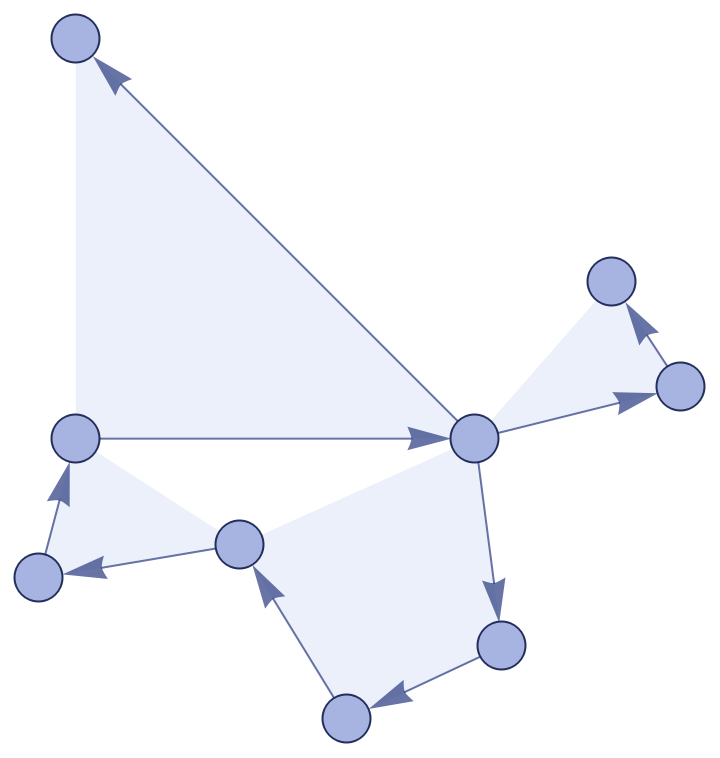 |
Display the labels for vertices:
| In[11]:= |
| Out[11]= | 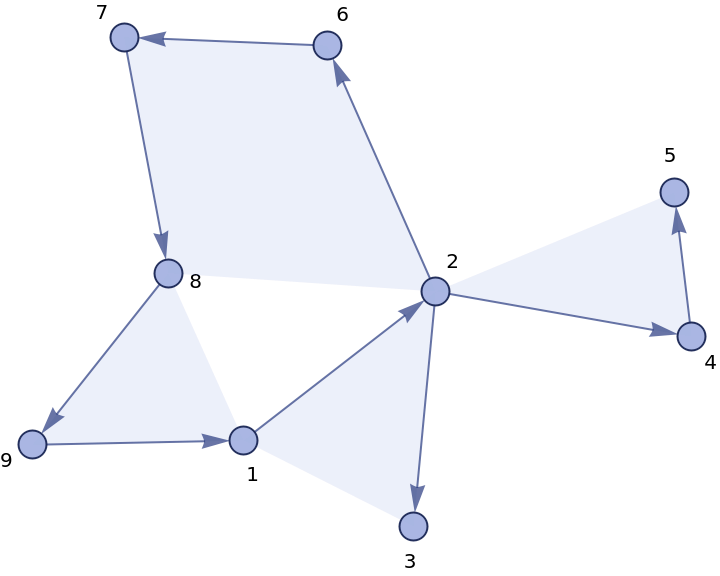 |
Make vertices appear larger:
| In[12]:= |
| Out[12]= | 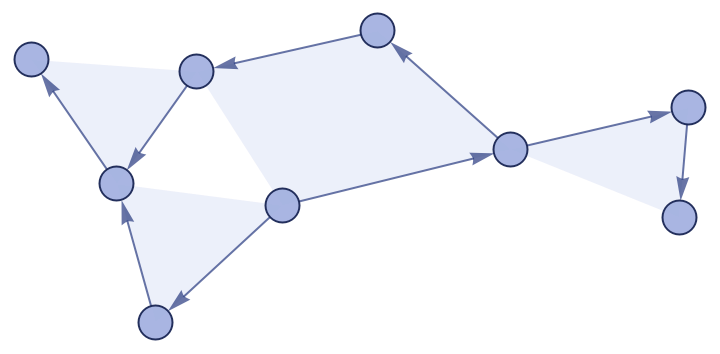 |
Make arrowheads appear larger:
| In[13]:= |
| Out[13]= | 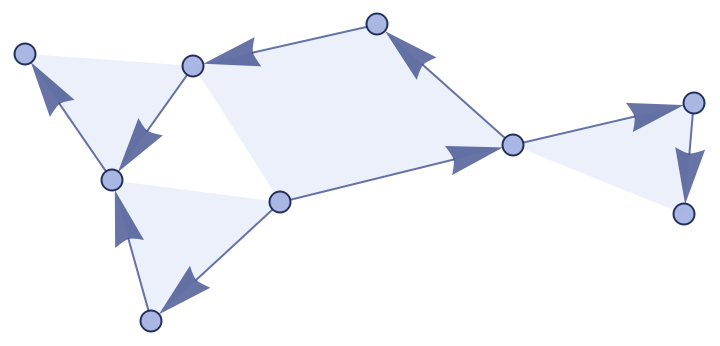 |
Reduce the maximum image size, but keep small hypergraphs small:
| In[14]:= |
| Out[14]= | 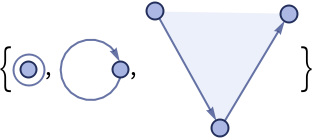 |
Specify an overall style:
| In[15]:= |
| Out[15]= |  |
Specify a style for vertices:
| In[16]:= |
| Out[16]= | 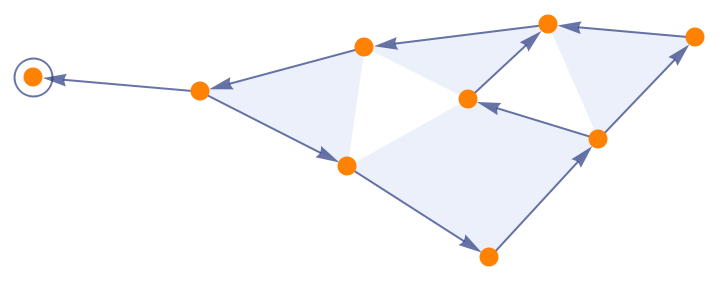 |
Styles for each vertex can be given as a List:
| In[17]:= |
| Out[17]= | 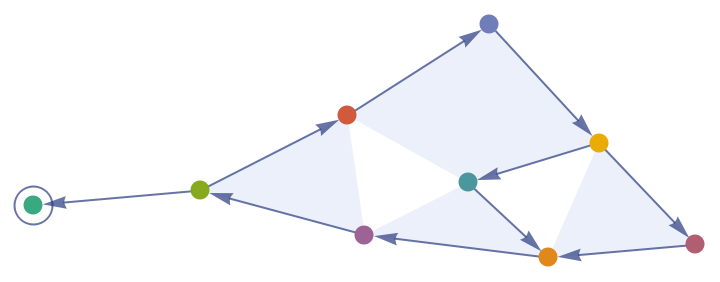 |
Styles for different vertex patterns can be given as an Association:
| In[18]:= |
| Out[18]= | 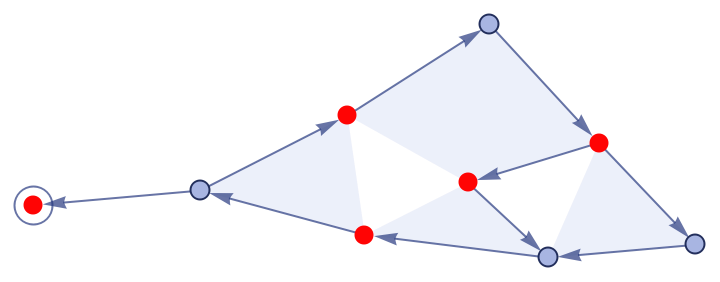 |
Specify a style for edges:
| In[19]:= |
| Out[19]= | 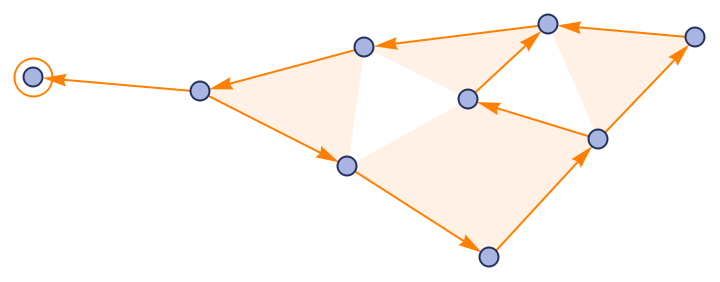 |
Styles for each edge can be given as a List:
| In[20]:= |
| Out[20]= | 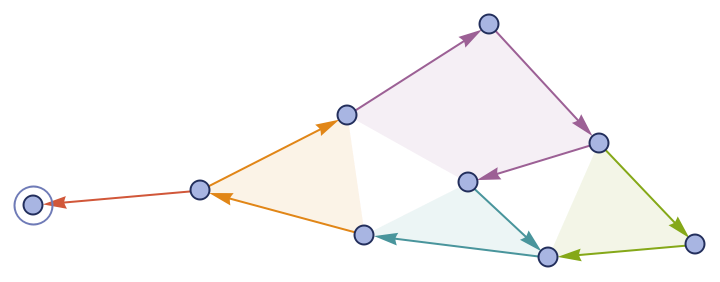 |
Styles for different edge patterns can be given as an Association:
| In[21]:= | ![ResourceFunction[
"WolframModelPlot", ResourceSystemBase -> "https://www.wolframcloud.com/obj/resourcesystem/api/1.0"][{{1, 2, 3}, {3, 4, 5}, {5, 6, 7, 1}, {7, 8, 2}, {4, 9}, {9}}, EdgeStyle -> <|{_} -> Darker@Blue, {_, _} -> Darker@Green, {_, _, _} -> Darker@Red, {_, _, _, _} -> Darker@Yellow|>]](https://www.wolframcloud.com/obj/resourcesystem/images/e8b/e8bdcbc9-6886-4c31-9f40-385a46089e07/512aaabc42b79939.png) |
| Out[21]= | 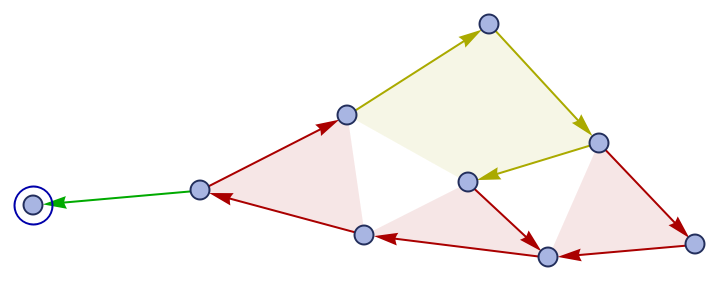 |
Specify a style for edge polygons:
| In[22]:= |
| Out[22]= | 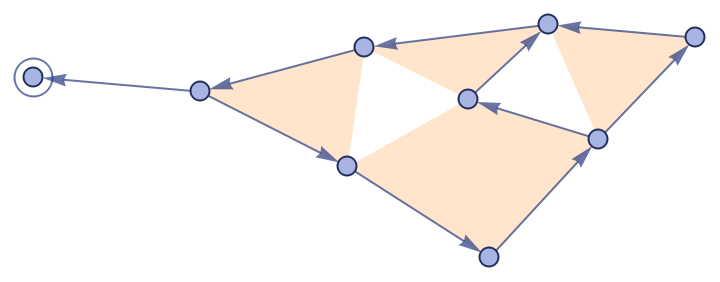 |
This can be specified independently from the style for edge lines:
| In[23]:= |
| Out[23]= | 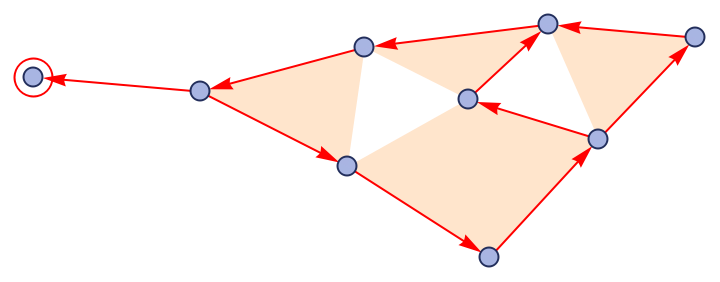 |
WolframModelPlot is used in various properties of WolframModel:
| In[24]:= |
| Out[24]= | 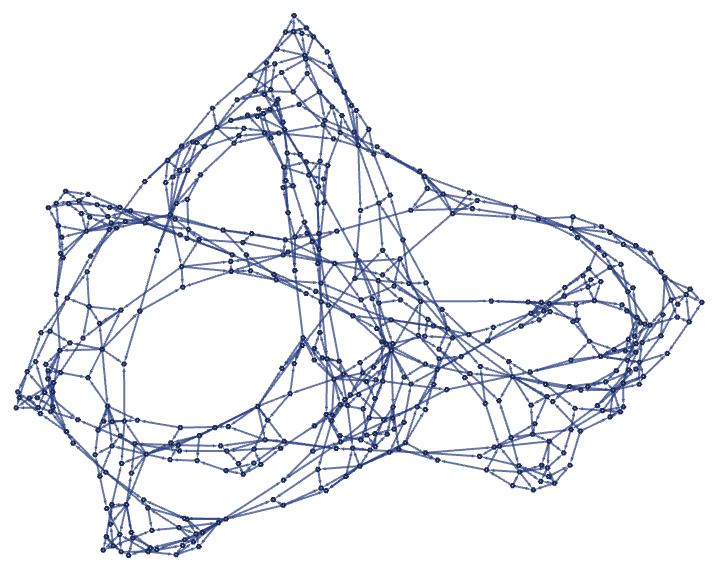 |
It is also used in RulePlot:
| In[25]:= |
| Out[25]= | 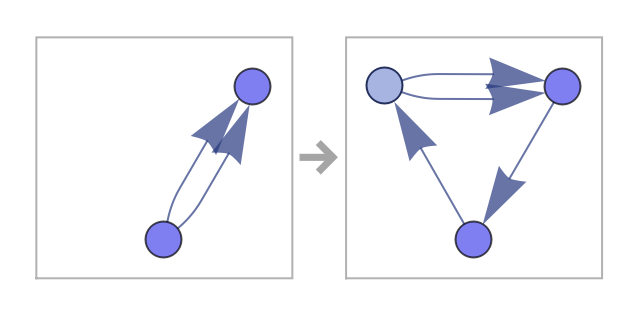 |
It may be hard to see the boundaries between hyperedges:
| In[26]:= |
| Out[26]= | 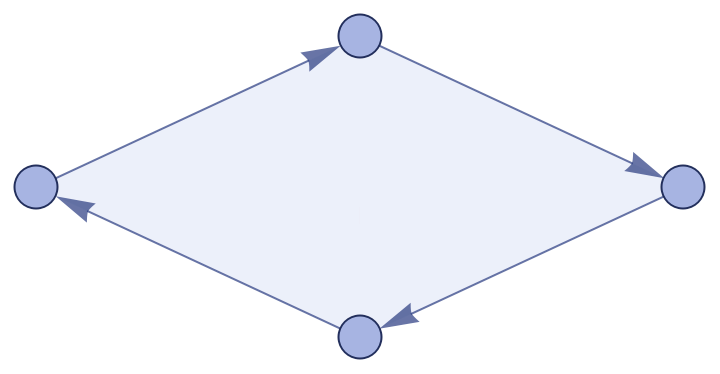 |
Using different colors for each edge might help:
| In[27]:= |
| Out[27]= | 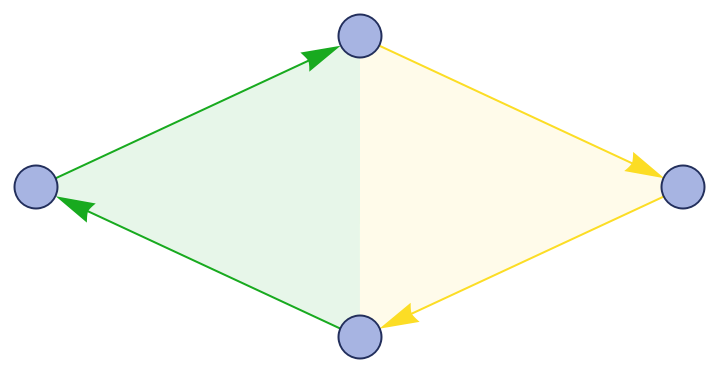 |
Manually specifying coordinates might break the scaling, so vertices and arrowheads may appear too large relative to the distance between vertices:
| In[28]:= |
| Out[28]= | 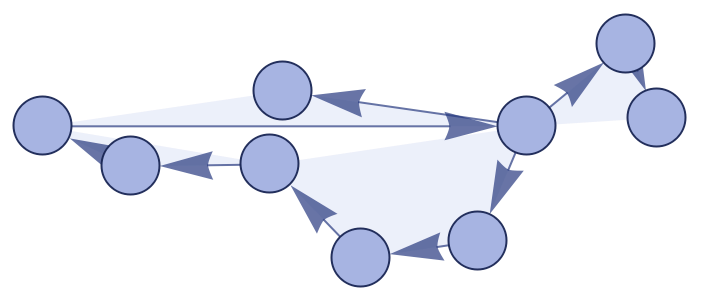 |
Manually reduce the vertex/arrowhead sizes to get a better-looking image:
| In[29]:= |
| Out[29]= | 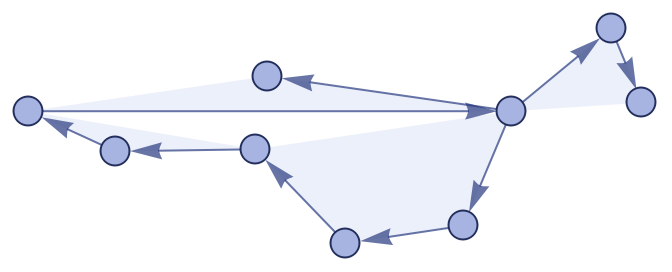 |
Make polygon art by getting rid of the vertices and arrowheads:
| In[30]:= |
| Out[30]= | 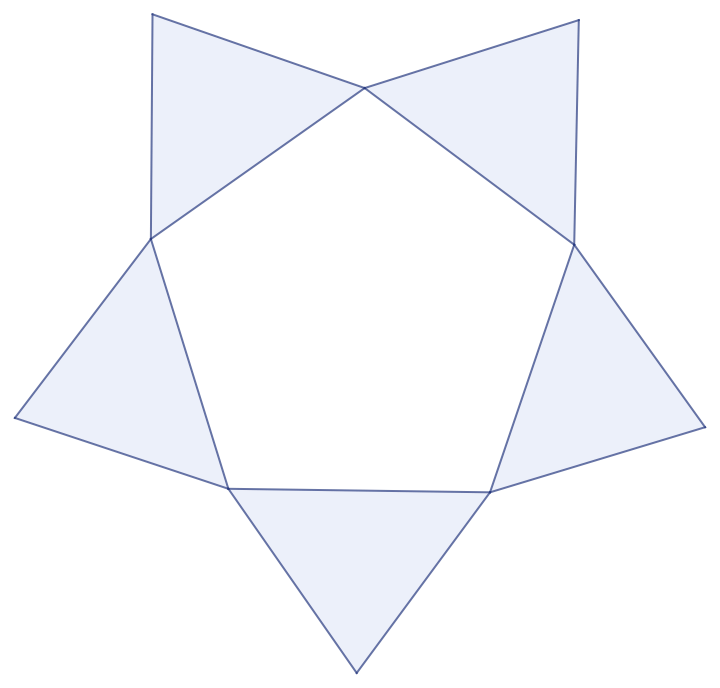 |
Make an unordered hypergraph plot by specifying a custom edge style:
| In[31]:= | ![ResourceFunction[
"WolframModelPlot", ResourceSystemBase -> "https://www.wolframcloud.com/obj/resourcesystem/api/1.0"][{{1}, {1, 2}, {2, 3}, {3, 4, 5}, {5, 6, 7, 1}},
"ArrowheadLength" -> 0, EdgeStyle -> <|{_, _, _ ..} -> Transparent|>,
"EdgePolygonStyle" -> <|{_, _, _ ..} -> Directive[Hue[0.63, 0.66, 0.81], Opacity[0.1], EdgeForm[Directive[Hue[0.63, 0.7, 0.5], Opacity[0.7]]]]|>]](https://www.wolframcloud.com/obj/resourcesystem/images/e8b/e8bdcbc9-6886-4c31-9f40-385a46089e07/71b99396f57203db.png) |
| Out[31]= | 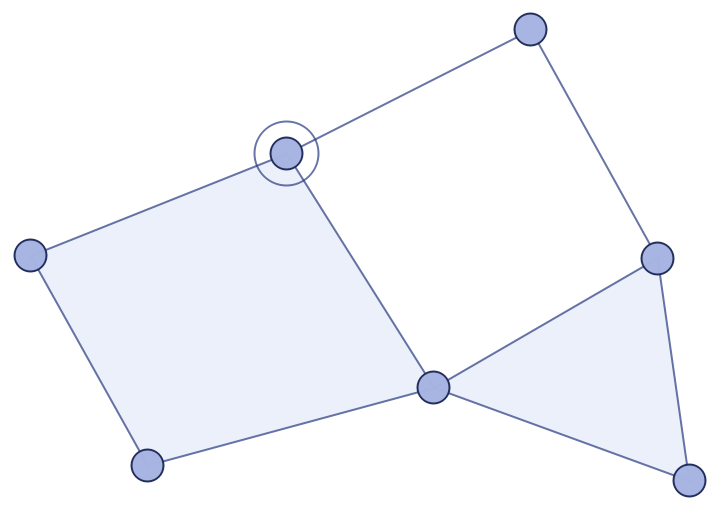 |
Display binary and ternary edges in different colors:
| In[32]:= | ![ResourceFunction[
"WolframModelPlot", ResourceSystemBase -> "https://www.wolframcloud.com/obj/resourcesystem/api/1.0"][
ResourceFunction[
"WolframModel"][{{1, 2, 3}, {4, 5, 6}, {2, 5}, {5, 2}} -> {{7, 1, 8}, {9, 3, 10}, {11, 4, 12}, {13, 6, 14}, {7, 13}, {13, 7}, {8, 10}, {10, 8}, {9, 11}, {11, 9}, {12, 14}, {14, 12}}, {{1, 2, 3}, {4, 5, 6}, {1, 4}, {4, 1}, {2, 5}, {5, 2}, {3, 6}, {6, 3}}, 6,
"FinalState"], EdgeStyle -> <|{_, _} -> Darker@Green, {_, _, _} -> Darker@Red|>]](https://www.wolframcloud.com/obj/resourcesystem/images/e8b/e8bdcbc9-6886-4c31-9f40-385a46089e07/068b99fc3f62153e.png) |
| Out[32]= | 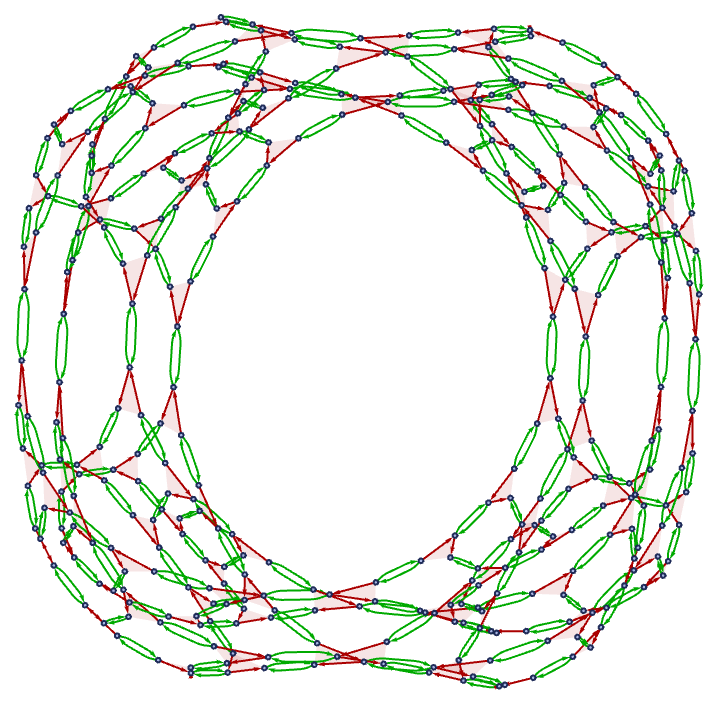 |
This work is licensed under a Creative Commons Attribution 4.0 International License