Wolfram Function Repository
Instant-use add-on functions for the Wolfram Language
Function Repository Resource:
Generate datasets from California COVID-19 data released by the State of California
ResourceFunction["CaliforniaCOVID19Data"][prop] returns the COVID-19 dataset for prop. |
Get the testing dataset:
| In[1]:= |
| Out[1]= |
Visualize testing:
| In[2]:= | ![Column[Normal@
testing[Entity[
"AdministrativeDivision", {"California", "UnitedStates"}]][
KeyValueMap[
DateListPlot[MovingAverage[#2, 7], PlotRange -> All, PlotTheme -> "Business", AspectRatio -> 1/4, ImageSize -> Medium, PlotLabel -> #1 <> ", CA", Filling -> Bottom] &]], Frame -> All]](https://www.wolframcloud.com/obj/resourcesystem/images/e87/e871846c-336f-460b-b98e-cf7ecb0ea98d/1226eb704f942e1c.png) |
| Out[2]= | 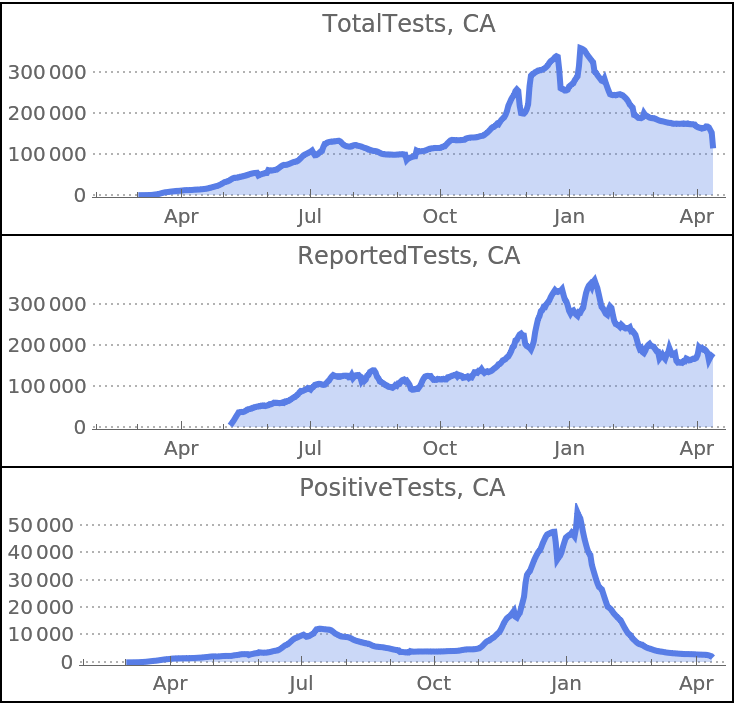 |
Get COVID-19 confirmed cases dataset:
| In[3]:= |
| Out[3]= |
Visualize daily cases:
| In[4]:= | ![Column[Normal@
cases[Entity[
"AdministrativeDivision", {"California", "UnitedStates"}]][
KeyValueMap[
DateListPlot[MovingAverage[#2, 7], PlotRange -> All, PlotTheme -> "Business", AspectRatio -> 1/4, ImageSize -> Medium, PlotLabel -> #1 <> ", Daily Data of CA", Filling -> Bottom] &]], Frame -> All]](https://www.wolframcloud.com/obj/resourcesystem/images/e87/e871846c-336f-460b-b98e-cf7ecb0ea98d/68aea927611b02c5.png) |
| Out[4]= | 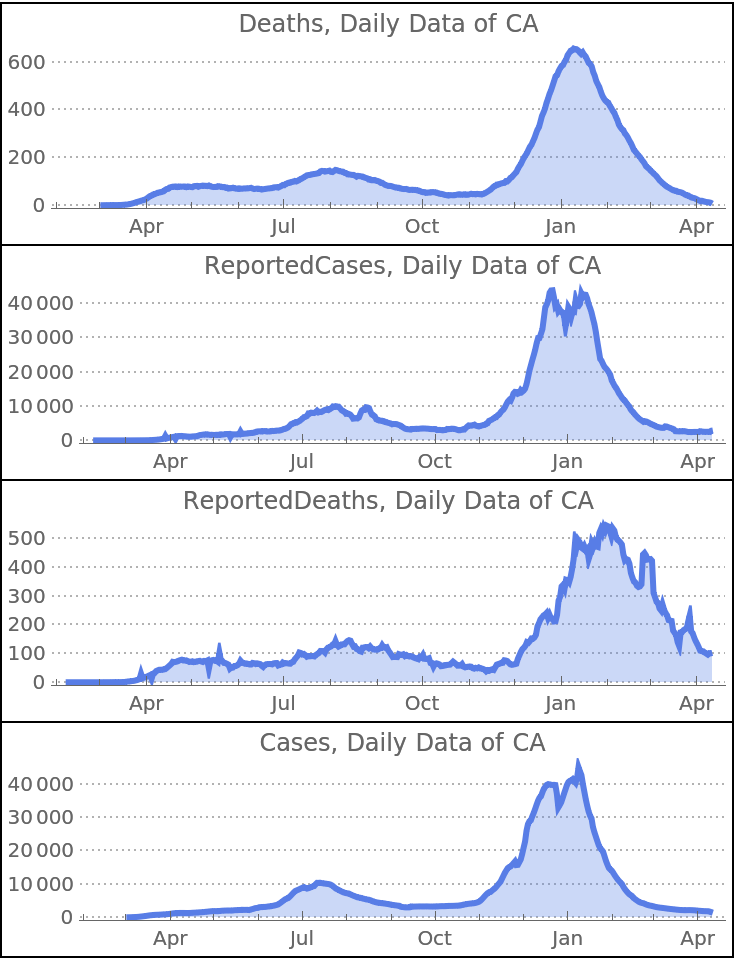 |
Visualize the ICU COVID-19 patients and ICU available beds:
| In[5]:= | ![DateListPlot[{(hospitals = ResourceFunction["CaliforniaCOVID19Data"]["Hospitals"])[Total, "ICUCovidConfirmedPatients"], hospitals[Total, "ICUAvailableBeds"]}, PlotTheme -> "Business", AspectRatio -> 1/4, ImageSize -> Large, PlotLabel -> "ICU Available Beds and ICU COVID19-Patients, California", PlotLegends -> {"ICU COVID19-Patients", "Available ICU Beds"}, Filling -> Bottom]](https://www.wolframcloud.com/obj/resourcesystem/images/e87/e871846c-336f-460b-b98e-cf7ecb0ea98d/3b7e5dfc6fbad71d.png) |
| Out[5]= | 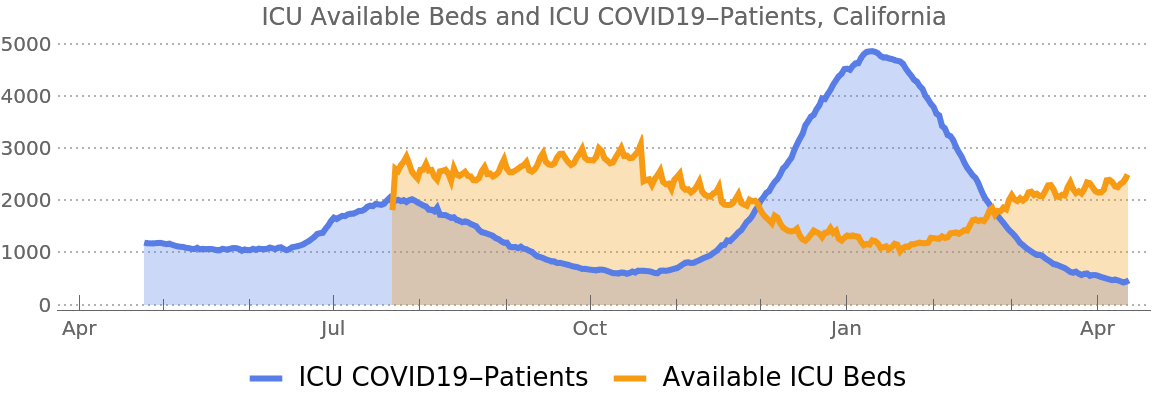 |
Visualize COVID-19 death across age groups:
| In[6]:= | ![With[{dt = ResourceFunction["CaliforniaCOVID19Data"][
"Age"][;; -3, #TotalCases["LastValue"] &]}, PieChart[dt, PlotLabel -> "Last Value of Total Cases", ChartLegends -> Normal@Keys[dt]]]](https://www.wolframcloud.com/obj/resourcesystem/images/e87/e871846c-336f-460b-b98e-cf7ecb0ea98d/18e131b2574ea7d5.png) |
| Out[6]= | 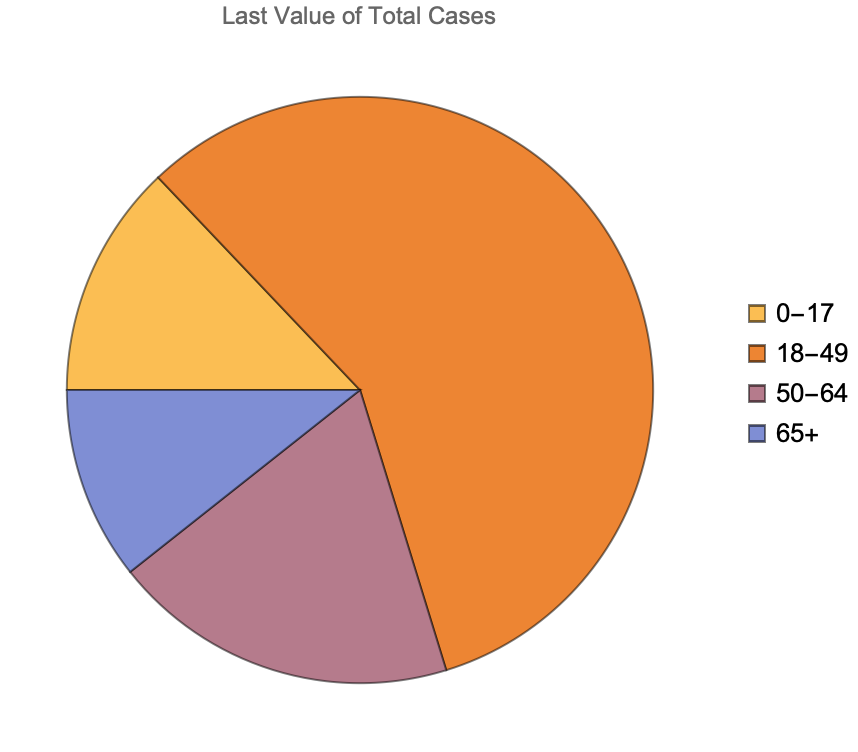 |
Use "Dictionary" to get the corresponding data dictionary:
| In[7]:= |
| Out[7]= |  |
This work is licensed under a Creative Commons Attribution 4.0 International License