Wolfram Function Repository
Instant-use add-on functions for the Wolfram Language
Function Repository Resource:
Represent an expression in an unevaluated form with a callout annotation
ResourceFunction["AnnotatedExpression"][expr,annotation] displays expr annotated with annotation below expr. | |
ResourceFunction["AnnotatedExpression"][expr,annotation,pos] displays expr with annotation in the position specified by pos. |
| CalloutStyle | Directive[LightGray,Thin] | style used for strokes of the callout |
| ImageSize | Automatic | the overall image size of the annotation expression displayed in the callout |
| ImageSizeAction | "ShrinkToFit" | action to take if the annotation size does not match the image size |
| ItemSize | 15 | width of the callout |
| LeaderSize | 1 | length to use for the callout leader |
| NeckSize | 1 | length to use for the callout neck |
Create a simple annotated expression:
| In[1]:= |
| Out[1]= |  |
Copy it and evaluate:
| In[2]:= |  |
| Out[2]= |
AnnotatedExpression returns an annotated version of the input without evaluating it:
| In[3]:= | ![ResourceFunction["AnnotatedExpression"][
RandomVariate[NormalDistribution[], 10],
"10 Standard Normal Variates",
ItemSize -> 22]](https://www.wolframcloud.com/obj/resourcesystem/images/e6f/e6fd1169-84a2-48a7-9b6c-6d3e3c8bc049/7719a9f9ebd94257.png) |
| Out[3]= |  |
Copying the output expression to an input cell results in each evaluation producing a new set of pseudo random numbers:
| In[4]:= | ![RandomVariate[
NormalDistribution[], 10]](https://www.wolframcloud.com/obj/resourcesystem/images/e6f/e6fd1169-84a2-48a7-9b6c-6d3e3c8bc049/445d96b9a83125af.png) |
| Out[4]= |
The annotation can be placed Above or Below the expression:
| In[5]:= |
| Out[5]= | 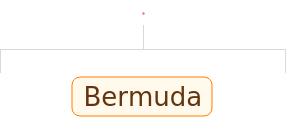 |
| In[6]:= |
| Out[6]= | 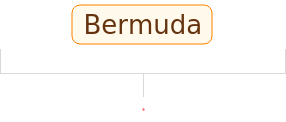 |
Copy the previous result and use it like the Entity it represents:
| In[7]:= | ![(* Evaluate this cell to get the example input *) CloudGet["https://www.wolframcloud.com/obj/28e82c20-aa71-482b-8ff2-a8369252baae"]](https://www.wolframcloud.com/obj/resourcesystem/images/e6f/e6fd1169-84a2-48a7-9b6c-6d3e3c8bc049/4140142347adf4bc.png) |
| Out[7]= |  |
Annotate an expression with information about itself:
| In[8]:= | ![ResourceFunction["AnnotatedExpression"][
CellularAutomaton[30, {{1}, 0}, 20],
RulePlot@CellularAutomaton[30],
ItemSize -> 20,
ImageSize -> Medium]](https://www.wolframcloud.com/obj/resourcesystem/images/e6f/e6fd1169-84a2-48a7-9b6c-6d3e3c8bc049/1ef07bf91c37b550.png) |
| Out[8]= | 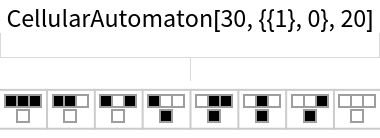 |
| In[9]:= | ![ArrayPlot[
CellularAutomaton[30, {{1}, 0}, 20] ]](https://www.wolframcloud.com/obj/resourcesystem/images/e6f/e6fd1169-84a2-48a7-9b6c-6d3e3c8bc049/7801b18a8ad52d97.png) |
| Out[9]= | 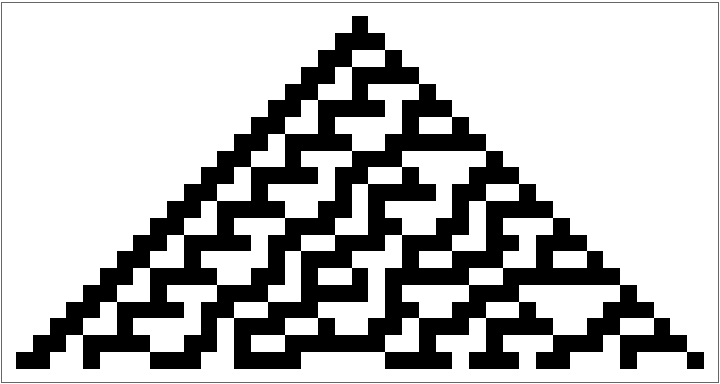 |
Annotate with a visual summary of the expression:
| In[10]:= | ![ResourceFunction["AnnotatedExpression"][
RandomVariate[PoissonDistribution[7], 200],
DiscretePlot[
PDF[PoissonDistribution[7], x], {x, 0, 20},
Filling -> Axis,
Axes -> {True, False}
],
ItemSize -> 25,
ImageSize -> Small]](https://www.wolframcloud.com/obj/resourcesystem/images/e6f/e6fd1169-84a2-48a7-9b6c-6d3e3c8bc049/2e1b31eca9324812.png) |
| Out[10]= | 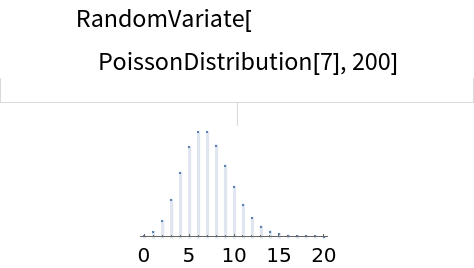 |
| In[11]:= | ![Histogram[
RandomVariate[
PoissonDistribution[7], 200] ]](https://www.wolframcloud.com/obj/resourcesystem/images/e6f/e6fd1169-84a2-48a7-9b6c-6d3e3c8bc049/152d3ebd2e3285ae.png) |
| Out[11]= | 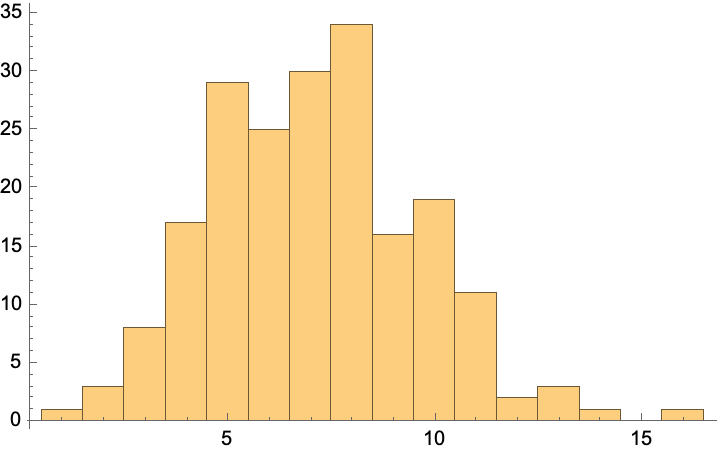 |
Annotate with a visualization of the expression:
| In[12]:= | ![{
ResourceFunction["AnnotatedExpression"][GaussianMatrix[3], MatrixPlot[GaussianMatrix[3], Frame -> False], ItemSize -> 10],
ResourceFunction["AnnotatedExpression"][HankelMatrix[7], MatrixPlot[HankelMatrix[7], Frame -> False], ItemSize -> 10]
}](https://www.wolframcloud.com/obj/resourcesystem/images/e6f/e6fd1169-84a2-48a7-9b6c-6d3e3c8bc049/0c13237e9b6cd2c0.png) |
| Out[12]= | 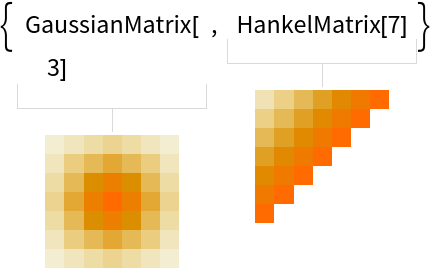 |
| In[13]:= | ![MatrixPlot@Dot[GaussianMatrix[3] , HankelMatrix[7]]](https://www.wolframcloud.com/obj/resourcesystem/images/e6f/e6fd1169-84a2-48a7-9b6c-6d3e3c8bc049/0a9a73d0636e1c9f.png) |
| Out[13]= | 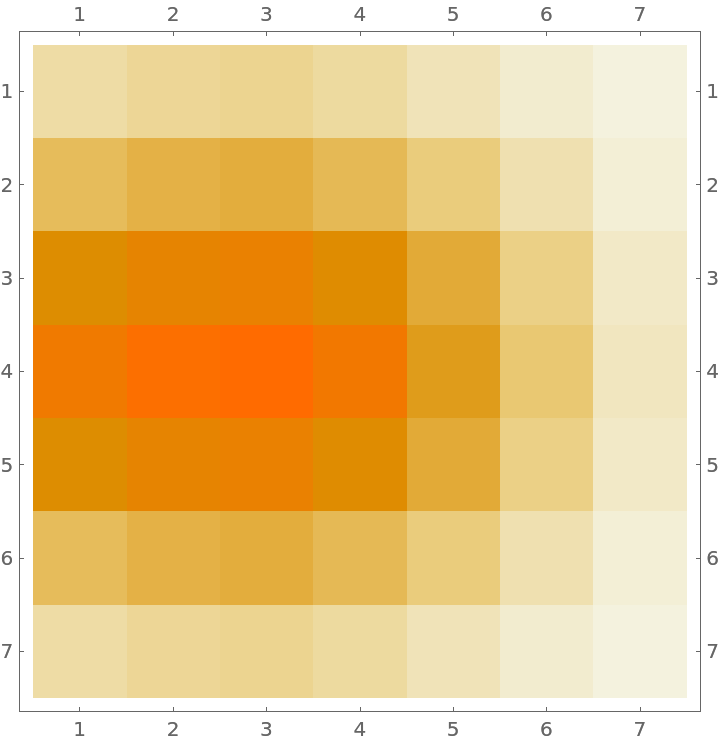 |
Supply a graphics directive:
| In[14]:= | ![ResourceFunction["AnnotatedExpression"][
Cone[],
Graphics3D[Cone[], Boxed -> False],
ItemSize -> 5,
CalloutStyle -> Orange
]](https://www.wolframcloud.com/obj/resourcesystem/images/e6f/e6fd1169-84a2-48a7-9b6c-6d3e3c8bc049/49b637fabe1d5c6c.png) |
| Out[14]= |
Combine multiple graphics directives with Directive:
| In[15]:= | ![ResourceFunction["AnnotatedExpression"][
Cone[],
Graphics3D[Cone[], Boxed -> False],
ItemSize -> 5,
CalloutStyle -> Directive[Orange, Thick, Dashed]
]](https://www.wolframcloud.com/obj/resourcesystem/images/e6f/e6fd1169-84a2-48a7-9b6c-6d3e3c8bc049/54b40080ad0445a5.png) |
| Out[15]= |
Specify the image size of the annotation:
| In[16]:= |
| Out[16]= | 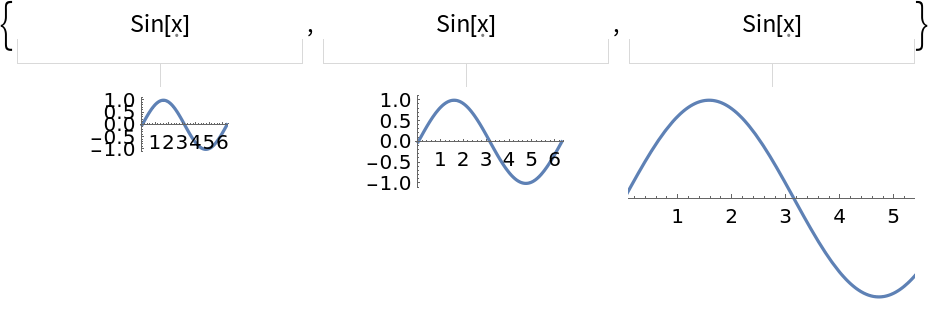 |
Use the "NeckSize" option to set the neck height of the annotation callout:
| In[20]:= | ![ResourceFunction["AnnotatedExpression"][
ExampleData[{"Statistics", "AirlinePassengerMiles"}],
BoxWhiskerChart[
ExampleData[{"Statistics", "AirlinePassengerMiles"}], Sequence[
BarOrigin -> Left, PlotTheme -> "Wide", Frame -> False]],
ItemSize -> 28, ImageSize -> Medium, "NeckSize" -> #] & /@ {1, 5}](https://www.wolframcloud.com/obj/resourcesystem/images/e6f/e6fd1169-84a2-48a7-9b6c-6d3e3c8bc049/2b196e7ae16e91f8.png) |
| Out[20]= | 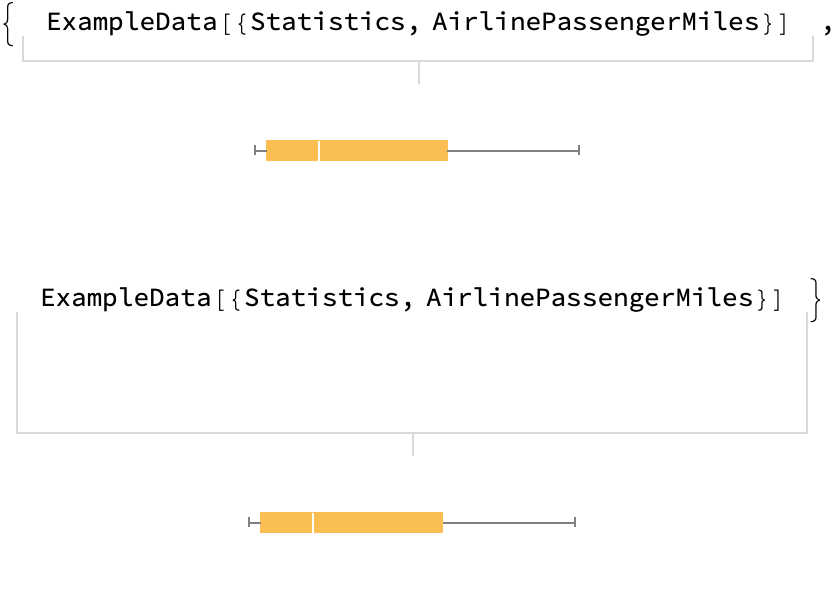 |
Several warning messages are generated when using a dynamic expression containing InputField:
| In[21]:= | ![DynamicSetting@
DynamicModule[{r = 5},
ResourceFunction["AnnotatedExpression"][
Range[InputField[Dynamic@r, Number, FieldSize -> 2]],
Dynamic@NumberLinePlot[Range[r]],
ItemSize -> 8
]]](https://www.wolframcloud.com/obj/resourcesystem/images/e6f/e6fd1169-84a2-48a7-9b6c-6d3e3c8bc049/4dfb29a68e4ffa8c.png) |
| Out[21]= | 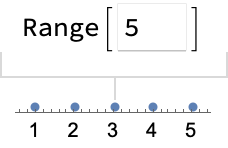 |
The messages are issued when the expression is evaluated:
| In[22]:= | ![Total[ \!\(\*
TagBox[
DynamicModuleBox[{$CellContext`r$$ = 10},
InterpretationBox[
TagBox[GridBox[{
{
TagBox[
RowBox[{"Range", "[",
InputFieldBox[Dynamic[$CellContext`r$$], Number,
FieldSize->2], "]"}],
HoldForm], "\[SpanFromLeft]"},
{
ItemBox["\<\"\"\>",
Frame->{{
Directive[
GrayLevel[0.85],
Thickness[Tiny]], None}, {
Directive[
GrayLevel[0.85],
Thickness[Tiny]], None}},
StripOnInput->False],
ItemBox["\<\"\"\>",
Frame->{{None,
Directive[
GrayLevel[0.85],
Thickness[Tiny]]}, {
Directive[
GrayLevel[0.85],
Thickness[Tiny]], None}},
StripOnInput->False]},
{
ItemBox["\<\"\"\>",
Frame->{{None,
Directive[
GrayLevel[0.85],
Thickness[Tiny]]}, Automatic},
StripOnInput->False],
ItemBox["\<\"\"\>",
Frame->{{
Directive[
GrayLevel[0.85],
Thickness[Tiny]], None}, Automatic},
StripOnInput->False]},
{
StyleBox[
PaneBox[
DynamicBox[ToBoxes[
NumberLinePlot[
Range[$CellContext`r$$]], StandardForm],
ImageSizeCache->{100., {8., 13.272562926242308`}}],
Alignment->Center,
ImageSize->Small,
ImageSizeAction->"ShrinkToFit"], "Output",
StripOnInput->False], "\[SpanFromLeft]"}
},
AutoDelete->False,
BaseStyle->"Output",
BaselinePosition->1,
GridBoxAlignment->{"Columns" -> {{Center}}},
GridBoxItemSize->{"Columns" -> {{4}}, "Rows" -> {Automatic}, "RowsIndexed" -> {2 -> 1, 3 -> 1}},
GridBoxSpacings->{"Columns" -> {{0}}, "Rows" -> {{0}}}],
"Grid"],
Range[
InputField[
Dynamic[$CellContext`r$$], Number, FieldSize -> 2]]],
DynamicModuleValues:>{}],
Setting]\) ]](https://www.wolframcloud.com/obj/resourcesystem/images/e6f/e6fd1169-84a2-48a7-9b6c-6d3e3c8bc049/3b1b97440e80b943.png) |
| Out[22]= |
Use Quiet to suppress these messages:
| In[23]:= | ![Quiet@Total[ \!\(\*
TagBox[
DynamicModuleBox[{$CellContext`r$$ = 10},
InterpretationBox[
TagBox[GridBox[{
{
TagBox[
RowBox[{"Range", "[",
InputFieldBox[Dynamic[$CellContext`r$$], Number,
FieldSize->2], "]"}],
HoldForm], "\[SpanFromLeft]"},
{
ItemBox["\<\"\"\>",
Frame->{{
Directive[
GrayLevel[0.85],
Thickness[Tiny]], None}, {
Directive[
GrayLevel[0.85],
Thickness[Tiny]], None}},
StripOnInput->False],
ItemBox["\<\"\"\>",
Frame->{{None,
Directive[
GrayLevel[0.85],
Thickness[Tiny]]}, {
Directive[
GrayLevel[0.85],
Thickness[Tiny]], None}},
StripOnInput->False]},
{
ItemBox["\<\"\"\>",
Frame->{{None,
Directive[
GrayLevel[0.85],
Thickness[Tiny]]}, Automatic},
StripOnInput->False],
ItemBox["\<\"\"\>",
Frame->{{
Directive[
GrayLevel[0.85],
Thickness[Tiny]], None}, Automatic},
StripOnInput->False]},
{
StyleBox[
PaneBox[
DynamicBox[ToBoxes[
NumberLinePlot[
Range[$CellContext`r$$]], StandardForm],
ImageSizeCache->{100., {8., 13.272562926242308`}}],
Alignment->Center,
ImageSize->Small,
ImageSizeAction->"ShrinkToFit"], "Output",
StripOnInput->False], "\[SpanFromLeft]"}
},
AutoDelete->False,
BaseStyle->"Output",
BaselinePosition->1,
GridBoxAlignment->{"Columns" -> {{Center}}},
GridBoxItemSize->{"Columns" -> {{4}}, "Rows" -> {Automatic}, "RowsIndexed" -> {2 -> 1, 3 -> 1}},
GridBoxSpacings->{"Columns" -> {{0}}, "Rows" -> {{0}}}],
"Grid"],
Range[
InputField[
Dynamic[$CellContext`r$$], Number, FieldSize -> 2]]],
DynamicModuleValues:>{}],
Setting]\) ]](https://www.wolframcloud.com/obj/resourcesystem/images/e6f/e6fd1169-84a2-48a7-9b6c-6d3e3c8bc049/26927a732e5a9b44.png) |
| Out[23]= |
Create a dynamic annotation to view the RulePlot of CellularAutomaton inline before evaluating the simulation:
| In[24]:= | ![DynamicSetting@
DynamicModule[{r = 30},
ResourceFunction["AnnotatedExpression"][
CellularAutomaton[
InputField[Dynamic@r, Number, FieldSize -> 2], {{1}, 0}, 16],
Dynamic[RulePlot@CellularAutomaton[r]], Sequence[
ItemSize -> 22, ImageSize -> Medium]]
]](https://www.wolframcloud.com/obj/resourcesystem/images/e6f/e6fd1169-84a2-48a7-9b6c-6d3e3c8bc049/1563dd2cc3276f96.png) |
| Out[24]= | 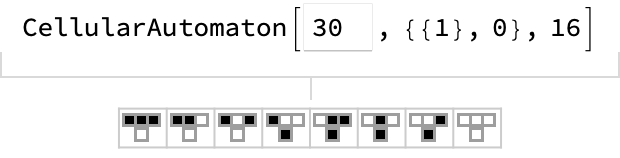 |
Update the rule and press the ![]() key to update the RulePlot annotation before plotting:
key to update the RulePlot annotation before plotting:
| In[25]:= | ![Quiet@ArrayPlot[ \!\(\*
TagBox[
DynamicModuleBox[{$CellContext`r$$ = 99},
InterpretationBox[
TagBox[GridBox[{
{
TagBox[
RowBox[{"CellularAutomaton", "[",
RowBox[{
InputFieldBox[Dynamic[$CellContext`r$$], Number,
FieldSize->2], ",",
RowBox[{"{",
RowBox[{
RowBox[{"{", "1", "}"}], ",", "0"}], "}"}], ",", "16"}], "]"}],
HoldForm], "\[SpanFromLeft]"},
{
ItemBox["\<\"\"\>",
Frame->{{
Directive[
GrayLevel[0.85],
Thickness[Tiny]], None}, {
Directive[
GrayLevel[0.85],
Thickness[Tiny]], None}},
StripOnInput->False],
ItemBox["\<\"\"\>",
Frame->{{None,
Directive[
GrayLevel[0.85],
Thickness[Tiny]]}, {
Directive[
GrayLevel[0.85],
Thickness[Tiny]], None}},
StripOnInput->False]},
{
ItemBox["\<\"\"\>",
Frame->{{None,
Directive[
GrayLevel[0.85],
Thickness[Tiny]]}, Automatic},
StripOnInput->False],
ItemBox["\<\"\"\>",
Frame->{{
Directive[
GrayLevel[0.85],
Thickness[Tiny]], None}, Automatic},
StripOnInput->False]},
{
StyleBox[
PaneBox[
DynamicBox[ToBoxes[
RulePlot[
CellularAutomaton[$CellContext`r$$]], StandardForm],
ImageSizeCache->{200., {11., 16.18}}],
Alignment->Center,
ImageSize->Medium,
ImageSizeAction->"ShrinkToFit"], "Output",
StripOnInput->False], "\[SpanFromLeft]"}
},
AutoDelete->False,
BaseStyle->"Output",
BaselinePosition->1,
GridBoxAlignment->{"Columns" -> {{Center}}},
GridBoxItemSize->{"Columns" -> {{11}}, "Rows" -> {Automatic}, "RowsIndexed" -> {2 -> 1, 3 -> 1}},
GridBoxSpacings->{"Columns" -> {{0}}, "Rows" -> {{0}}}],
"Grid"],
CellularAutomaton[
InputField[
Dynamic[$CellContext`r$$], Number, FieldSize -> 2], {{1}, 0}, 16]],
DynamicModuleValues:>{}],
Setting]\) ]](https://www.wolframcloud.com/obj/resourcesystem/images/e6f/e6fd1169-84a2-48a7-9b6c-6d3e3c8bc049/500d6f9552fa51b2.png) |
| Out[25]= |  |
Create dynamic annotations to view graphics primitives inline before evaluating the plot:
| In[26]:= | ![{
DynamicSetting@
DynamicModule[{shade = HalftoneShading[]},
ResourceFunction["AnnotatedExpression"][
PopupMenu[
Dynamic[shade], {HalftoneShading[], StippleShading[], HatchShading[], GoochShading[]}],
Dynamic[
Graphics3D[{shade, InfinitePlane[{{1, 0, 0}, {1, 1, 1}, {0, 0, 1}}]}, Boxed -> False]],
Above,
ItemSize -> 10]
],
DynamicSetting@
DynamicModule[{shp = Cone[]},
ResourceFunction["AnnotatedExpression"][
PopupMenu[
Dynamic[shp], {Cone[], Sphere[], Cuboid[], Octahedron[]}],
Dynamic[Graphics3D[shp, Boxed -> False]],
Above,
ItemSize -> 10]
]
}](https://www.wolframcloud.com/obj/resourcesystem/images/e6f/e6fd1169-84a2-48a7-9b6c-6d3e3c8bc049/0469d2388f83ff68.png) |
| Out[26]= | 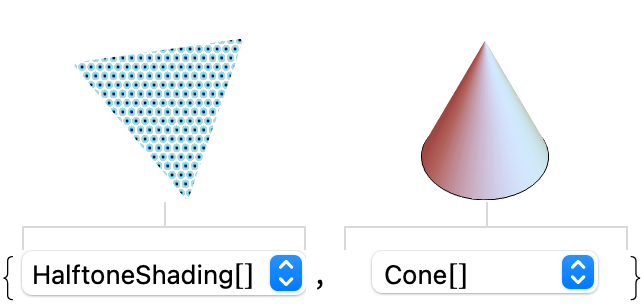 |
| In[27]:= | ![Graphics3D[{\!\(\*
TagBox[
DynamicModuleBox[{$CellContext`shade$$ = HalftoneShading[0.5]},
InterpretationBox[
TagBox[GridBox[{
{
StyleBox[
PaneBox[
DynamicBox[ToBoxes[
Graphics3D[{$CellContext`shade$$,
InfinitePlane[{{1, 0, 0}, {1, 1, 1}, {0, 0, 1}}]}, Boxed -> False], StandardForm],
ImageSizeCache->{100., {48., 52.}}],
Alignment->Center,
ImageSize->Small,
ImageSizeAction->"ShrinkToFit"], "Output",
StripOnInput->False], "\[SpanFromLeft]"},
{
ItemBox["\<\"\"\>",
Frame->{{None,
Directive[
GrayLevel[0.85],
Thickness[Tiny]]}, Automatic},
StripOnInput->False],
ItemBox["\<\"\"\>",
Frame->{{
Directive[
GrayLevel[0.85],
Thickness[Tiny]], None}, Automatic},
StripOnInput->False]},
{
ItemBox["\<\"\"\>",
Frame->{{
Directive[
GrayLevel[0.85],
Thickness[Tiny]], None}, {None,
Directive[
GrayLevel[0.85],
Thickness[Tiny]]}},
StripOnInput->False],
ItemBox["\<\"\"\>",
Frame->{{None,
Directive[
GrayLevel[0.85],
Thickness[Tiny]]}, {None,
Directive[
GrayLevel[0.85],
Thickness[Tiny]]}},
StripOnInput->False]},
{
TagBox[
PopupMenuBox[Dynamic[$CellContext`shade$$], {HalftoneShading[0.5]-> RowBox[{"HalftoneShading", "[", "]"}], StippleShading[
0.5]->
RowBox[{"StippleShading", "[", "]"}], HatchShading[0.5]->
RowBox[{"HatchShading", "[", "]"}], GoochShading[{
LABColor[0.25, 0.4, -0.65],
LABColor[0.55, 0.65, 0.65],
LABColor[0.9, 0.05, 0.4]}]->
RowBox[{"GoochShading", "[", "]"}]}],
HoldForm], "\[SpanFromLeft]"}
},
AutoDelete->False,
BaseStyle->"Output",
BaselinePosition->4,
GridBoxAlignment->{"Columns" -> {{Center}}},
GridBoxItemSize->{"Columns" -> {{5}}, "Rows" -> {Automatic}, "RowsIndexed" -> {3 -> 1, 2 -> 1}},
GridBoxSpacings->{"Columns" -> {{0}}, "Rows" -> {{0}}}],
"Grid"],
PopupMenu[
Dynamic[$CellContext`shade$$], {
HalftoneShading[],
StippleShading[],
HatchShading[],
GoochShading[]}]],
DynamicModuleValues:>{}],
Setting]\) , \!\(\*
TagBox[
DynamicModuleBox[{$CellContext`shp$$ = Cone[{{0, 0, -1}, {0, 0, 1}}]},
InterpretationBox[
TagBox[GridBox[{
{
StyleBox[
PaneBox[
DynamicBox[ToBoxes[
Graphics3D[$CellContext`shp$$, Boxed -> False], StandardForm],
ImageSizeCache->{100., {48., 52.}}],
Alignment->Center,
ImageSize->Small,
ImageSizeAction->"ShrinkToFit"], "Output",
StripOnInput->False], "\[SpanFromLeft]"},
{
ItemBox["\<\"\"\>",
Frame->{{None,
Directive[
GrayLevel[0.85],
Thickness[Tiny]]}, Automatic},
StripOnInput->False],
ItemBox["\<\"\"\>",
Frame->{{
Directive[
GrayLevel[0.85],
Thickness[Tiny]], None}, Automatic},
StripOnInput->False]},
{
ItemBox["\<\"\"\>",
Frame->{{
Directive[
GrayLevel[0.85],
Thickness[Tiny]], None}, {None,
Directive[
GrayLevel[0.85],
Thickness[Tiny]]}},
StripOnInput->False],
ItemBox["\<\"\"\>",
Frame->{{None,
Directive[
GrayLevel[0.85],
Thickness[Tiny]]}, {None,
Directive[
GrayLevel[0.85],
Thickness[Tiny]]}},
StripOnInput->False]},
{
TagBox[
PopupMenuBox[Dynamic[$CellContext`shp$$], {
Cone[{{0, 0, -1}, {0, 0, 1}}]->
RowBox[{
"Cone", "[", "]"}], Sphere[{0, 0, 0}]->
RowBox[{
"Sphere", "[", "]"}], Cuboid[{0, 0, 0}]->
RowBox[{
"Cuboid", "[", "]"}], Octahedron[]->
RowBox[{
"Octahedron", "[", "]"}]}],
HoldForm], "\[SpanFromLeft]"}
},
AutoDelete->False,
BaseStyle->"Output",
BaselinePosition->4,
GridBoxAlignment->{"Columns" -> {{Center}}},
GridBoxItemSize->{"Columns" -> {{5}}, "Rows" -> {Automatic}, "RowsIndexed" -> {3 -> 1, 2 -> 1}},
GridBoxSpacings->{"Columns" -> {{0}}, "Rows" -> {{0}}}],
"Grid"],
PopupMenu[
Dynamic[$CellContext`shp$$], {
Cone[],
Sphere[],
Cuboid[],
Octahedron[]}]],
DynamicModuleValues:>{}],
Setting]\)}, Lighting -> "Accent"]](https://www.wolframcloud.com/obj/resourcesystem/images/e6f/e6fd1169-84a2-48a7-9b6c-6d3e3c8bc049/4dd4a8a022055de6.png) |
| Out[27]= | 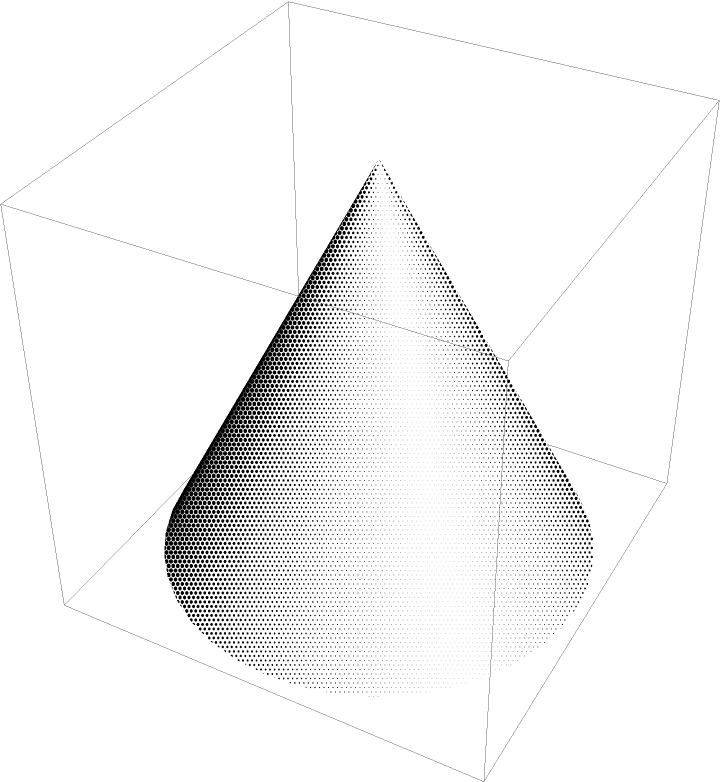 |
This work is licensed under a Creative Commons Attribution 4.0 International License
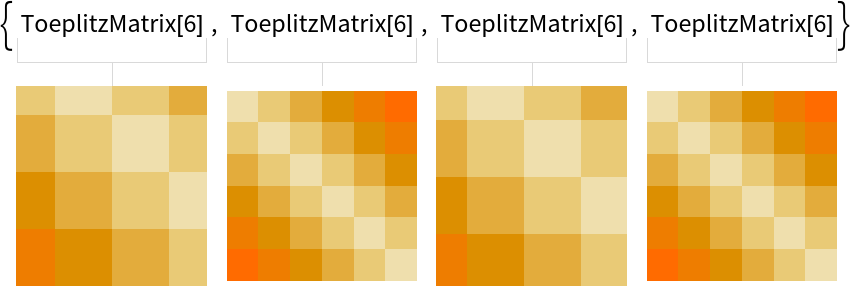
![ResourceFunction["AnnotatedExpression"][
ToeplitzMatrix[6],
MatrixPlot[ToeplitzMatrix[6], Frame -> False, ImageSize -> 180], ItemSize -> 10,
ImageSizeAction -> #] & /@ {"Clip", "ResizeToFit", "Scrollable", "ShrinkToFit"}](https://www.wolframcloud.com/obj/resourcesystem/images/e6f/e6fd1169-84a2-48a7-9b6c-6d3e3c8bc049/0bb3a9b261b4e1a3.png)
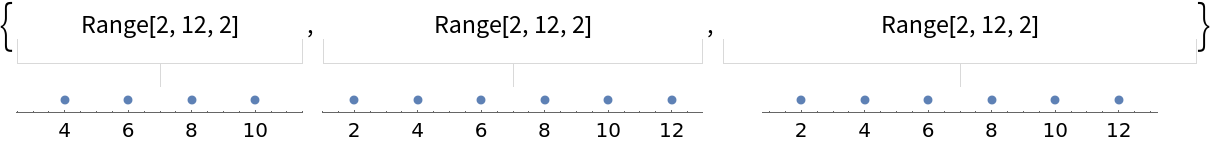
![ResourceFunction["AnnotatedExpression"][
Range[2, 12, 2],
NumberLinePlot[Range[2, 12, 2]],
ImageSize -> Medium,
ItemSize -> #
] & /@ Range[15, 25, 5]](https://www.wolframcloud.com/obj/resourcesystem/images/e6f/e6fd1169-84a2-48a7-9b6c-6d3e3c8bc049/3cafe79420456020.png)
![ResourceFunction["AnnotatedExpression"][
ExampleData[{"Statistics", "AirlinePassengerMiles"}],
BoxWhiskerChart[
ExampleData[{"Statistics", "AirlinePassengerMiles"}], Sequence[
BarOrigin -> Left, PlotTheme -> "Wide", Frame -> False]],
ItemSize -> 28, ImageSize -> Medium, LeaderSize -> #] & /@ {1, 5}](https://www.wolframcloud.com/obj/resourcesystem/images/e6f/e6fd1169-84a2-48a7-9b6c-6d3e3c8bc049/2300ac2cb6e5d74b.png)
