Wolfram Function Repository
Instant-use add-on functions for the Wolfram Language
Function Repository Resource:
Visualize the constellations and the stars contained within their boundaries
ResourceFunction["ConstellationChart"][const] generates a chart of the specified constellation const. |
| "BoundaryLineStyle" | boundary line style | |
| "GridStyle" | grid style | |
| "HighlightedRegionStyle" | Opacity[0] | highlighted region style |
| "LineArtStyle" | line art style | |
| "MagnitudeLimit" | 5 | magnitude limit |
| "MagnitudeScalingFunction" | (Max[0,0.02 -0.0023#1]&) | magnitude scaling function |
| "MaskRegionStyle" | mask region style | |
| "StarLabels" | Automatic | star labels |
| "StarStyle" | star style |
Visualize the constellation Orion, its boundaries, line art, and the stars it contains:
| In[1]:= |
| Out[1]= | 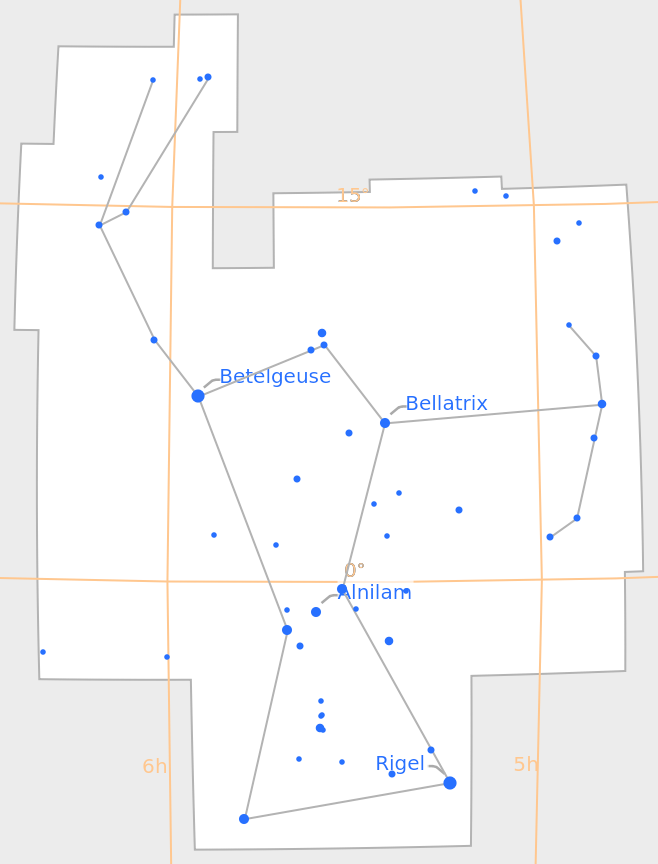 |
Interpret the specified string as a constellation entity:
| In[2]:= |
| Out[2]= |  |
Supported constellations include Northern Hemisphere constellations, like Ursa Major:
| In[3]:= |
| Out[3]= | 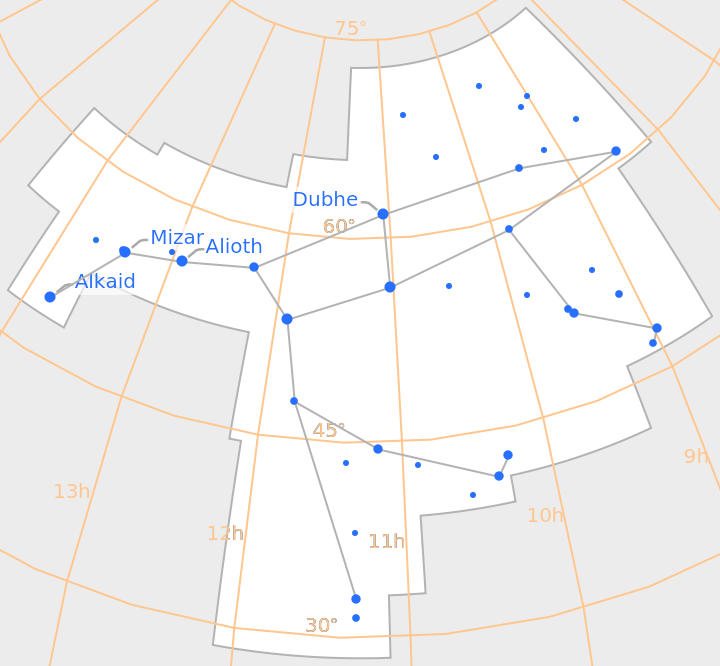 |
Southern Hemisphere constellations like Crux are also supported:
| In[4]:= |
| Out[4]= | 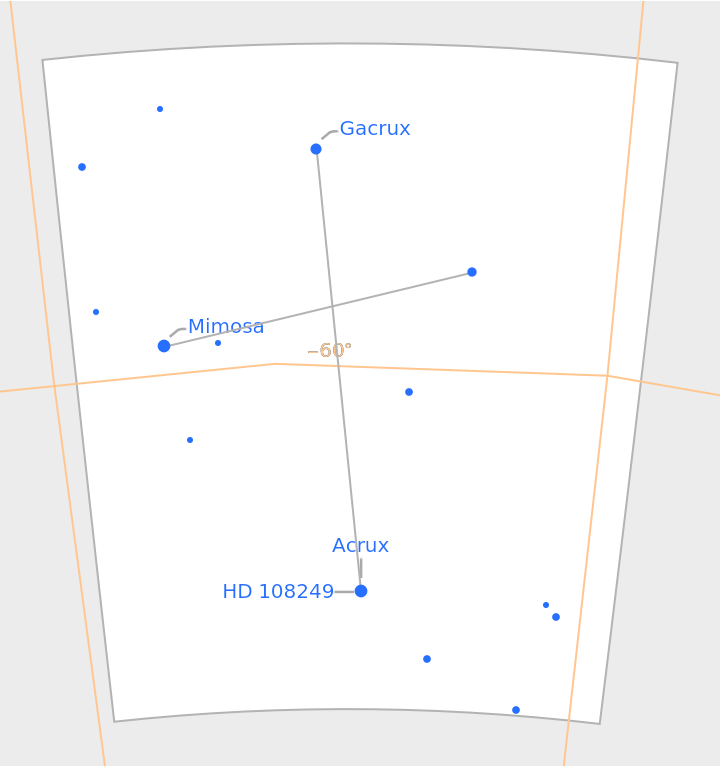 |
The boundary line style can be changed:
| In[5]:= |
| Out[5]= | 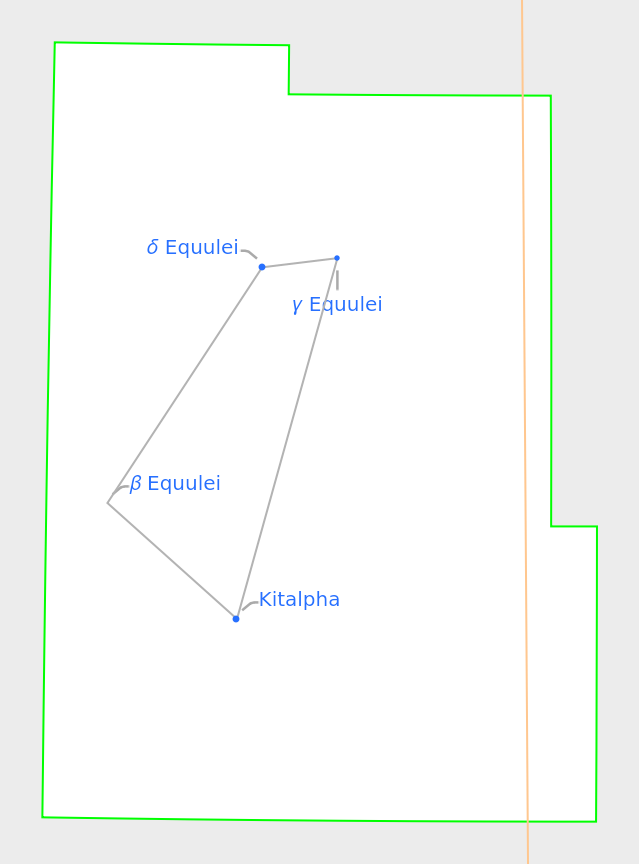 |
The boundary line can also be turned off:
| In[6]:= |
| Out[6]= | 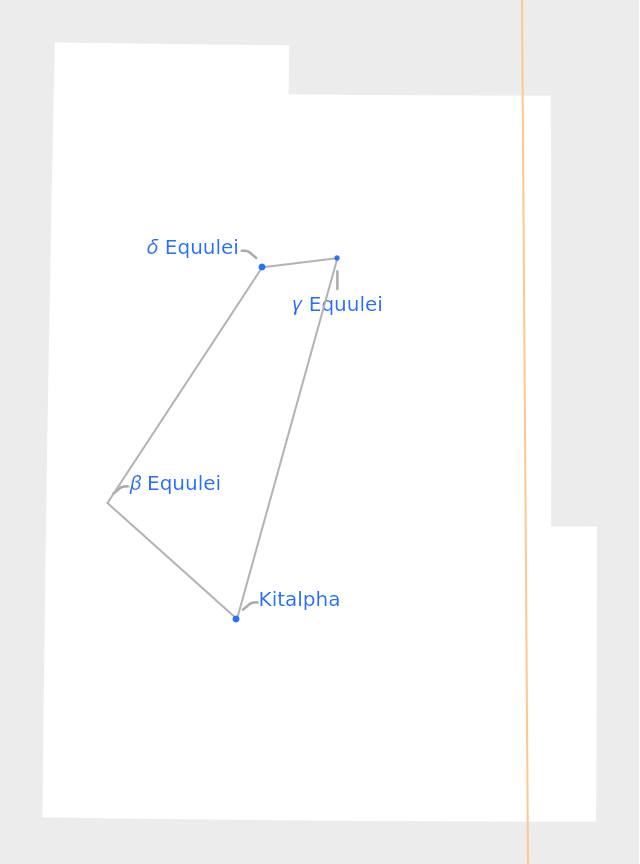 |
The style of the equatorial coordinate grid can be changed:
| In[7]:= |
| Out[7]= | 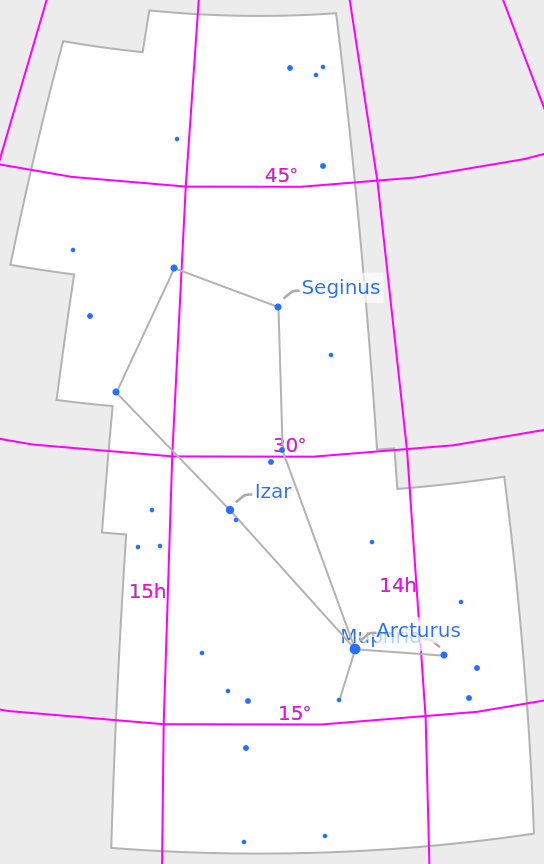 |
The equatorial coordinate grid can also be turned off:
| In[8]:= |
| Out[8]= | 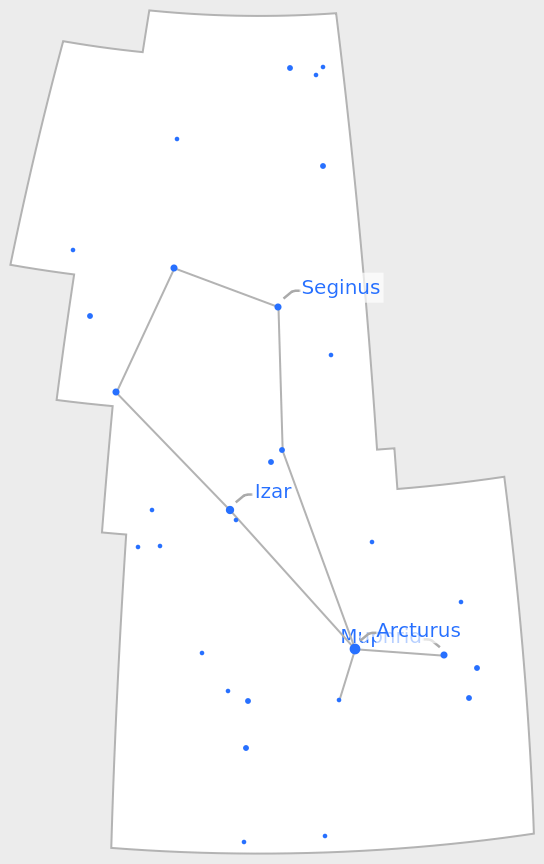 |
The style of the highlighted region can be changed:
| In[9]:= |
| Out[9]= | 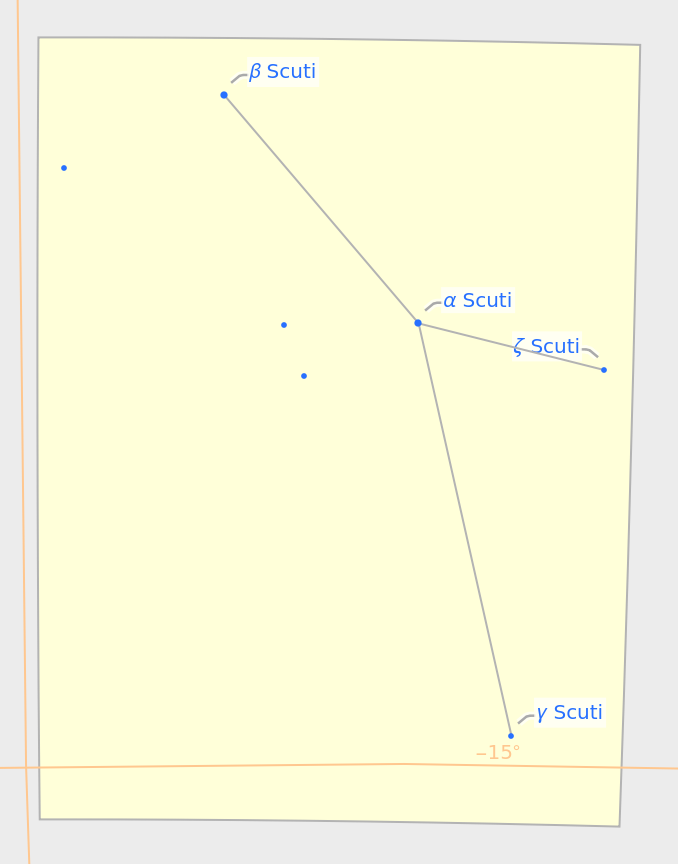 |
The highlighted region can also be turned off:
| In[10]:= |
| Out[10]= |  |
The style of line art can be changed:
| In[11]:= |
| Out[11]= | 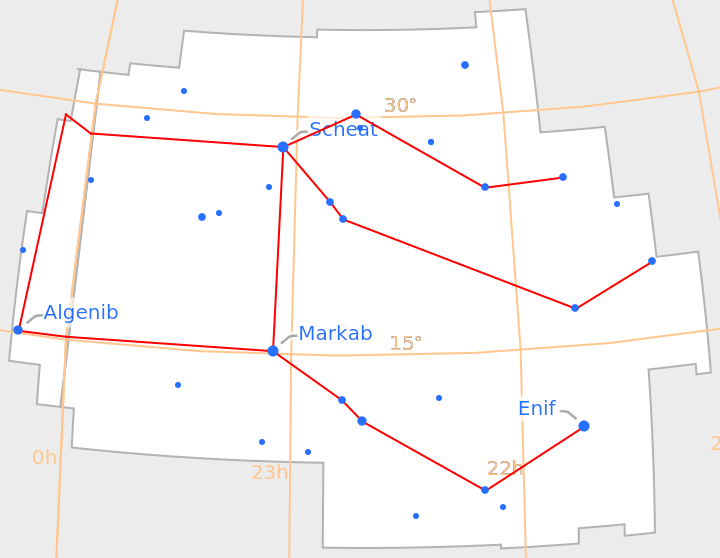 |
Line art can also be turned off:
| In[12]:= |
| Out[12]= | 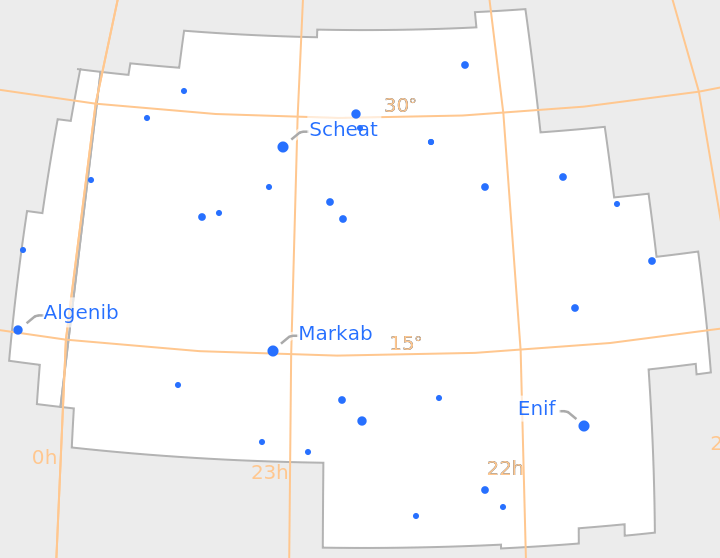 |
Fainter stars can be seen by changing the magnitude limit:
| In[13]:= |
| Out[13]= | 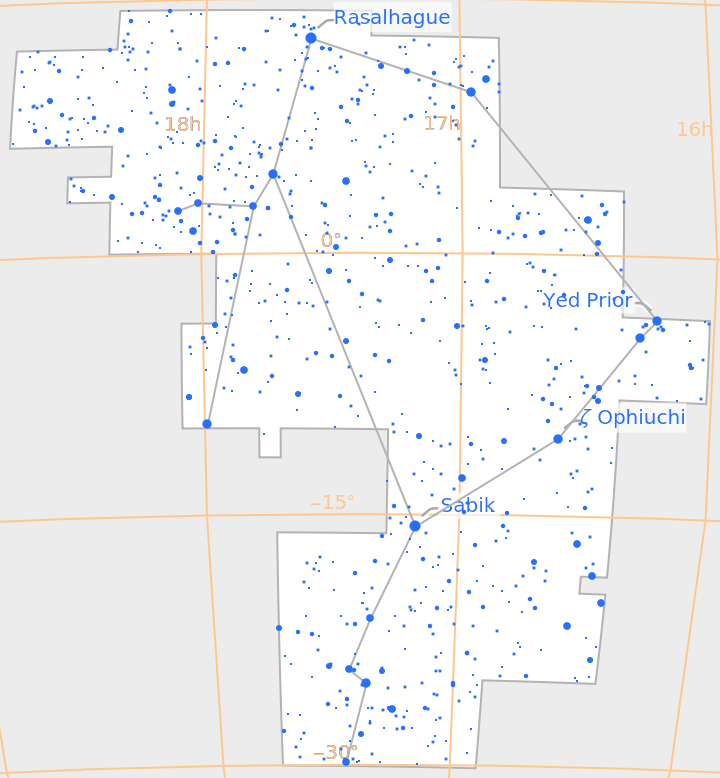 |
Constellations like Sagittarius have many faint stars due to being in the direction of the galactic center:
| In[14]:= |
| Out[14]= | 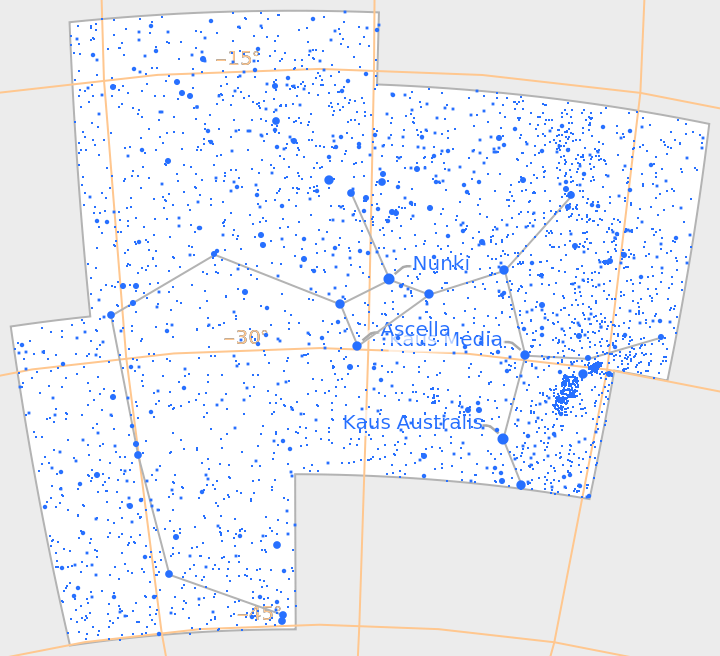 |
Constellations like Coma Berenices have relatively fewer stars due to being observed far from the galactic plane:
| In[15]:= |
| Out[15]= | 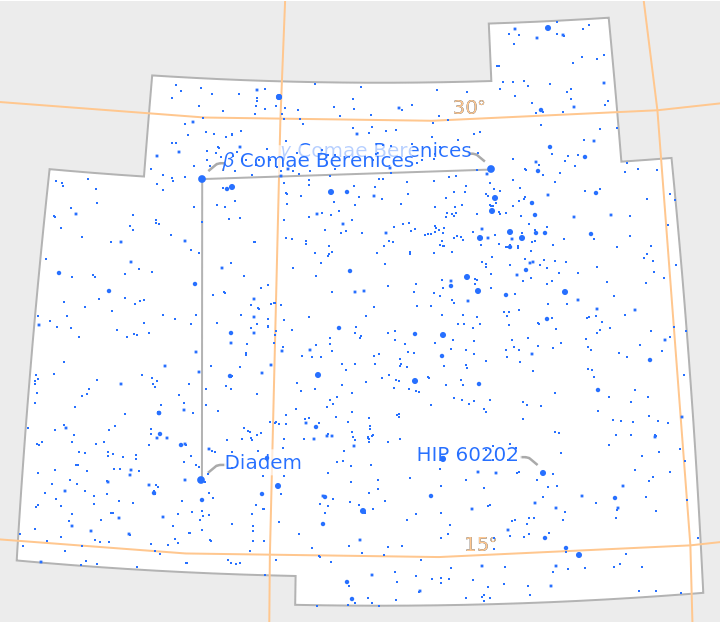 |
Provide a different scaling function for stars based on apparent magnitude:
| In[16]:= | ![ResourceFunction["ConstellationChart"][
Entity["Constellation", "Gemini"], "MagnitudeScalingFunction" -> (Max[0, 0.1 - 0.02*#] &)]](https://www.wolframcloud.com/obj/resourcesystem/images/e1d/e1d899ae-5b27-43c9-a419-8c11eec67d82/41d070a5ec5911a9.png) |
| Out[16]= | 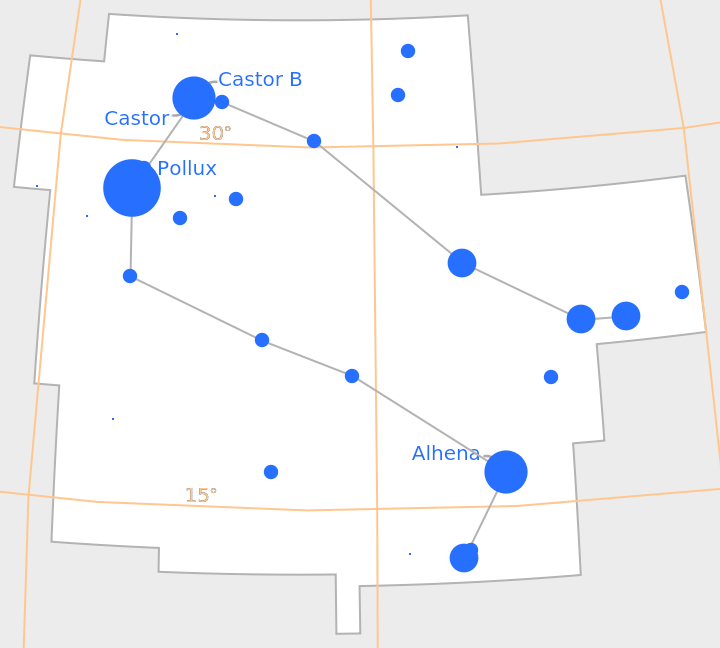 |
The style of the outer mask region can be changed:
| In[17]:= |
| Out[17]= |  |
The outer mask region can also be removed:
| In[18]:= |
| Out[18]= |  |
Zooming into a specific area of a constellation region can be done using PlotRange, such as this view of the Pleiades star cluster in Taurus:
| In[19]:= | ![ResourceFunction["ConstellationChart"][
Entity["Constellation", "Taurus"], "MagnitudeLimit" -> 8, PlotRange -> {{.17, .21}, {.125, .145}}, "MagnitudeScalingFunction" -> (Max[0, 0.03 - 0.0023*#] &), LabelStyle -> Brown]](https://www.wolframcloud.com/obj/resourcesystem/images/e1d/e1d899ae-5b27-43c9-a419-8c11eec67d82/0bf1ceb694c9f5d2.png) |
| Out[19]= | 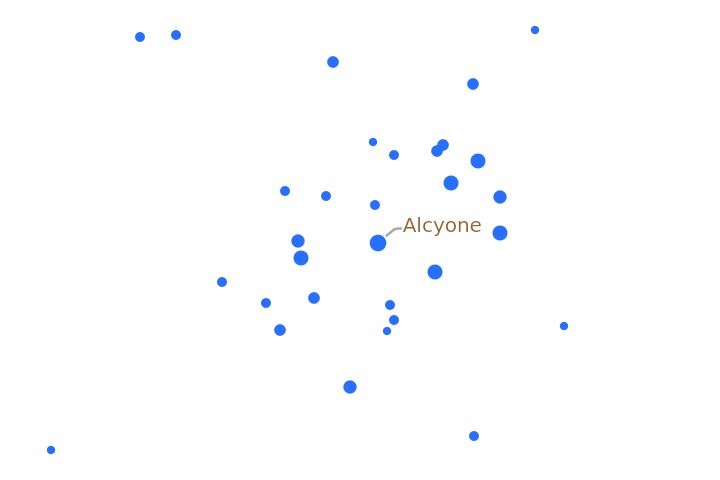 |
Label the eight brightest stars:
| In[20]:= |
| Out[20]= | 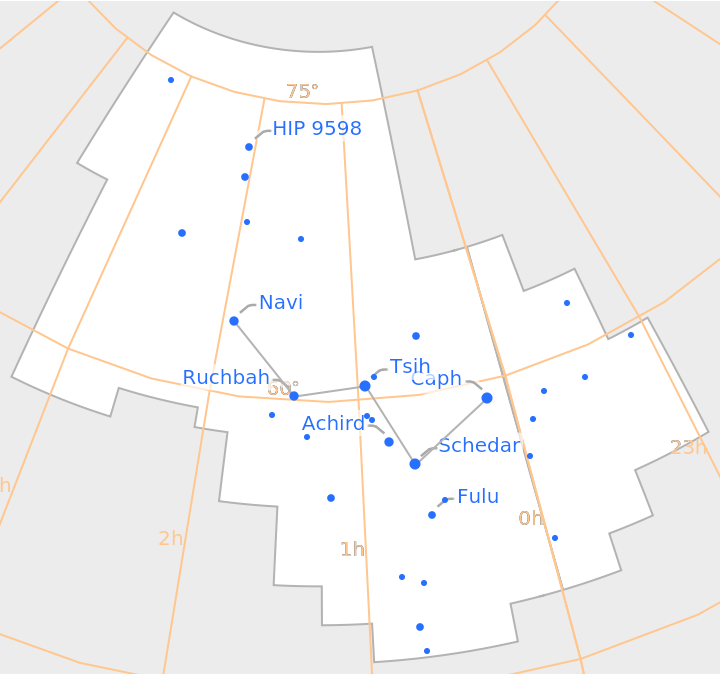 |
The style of the stars can be changed:
| In[21]:= |
| Out[21]= | 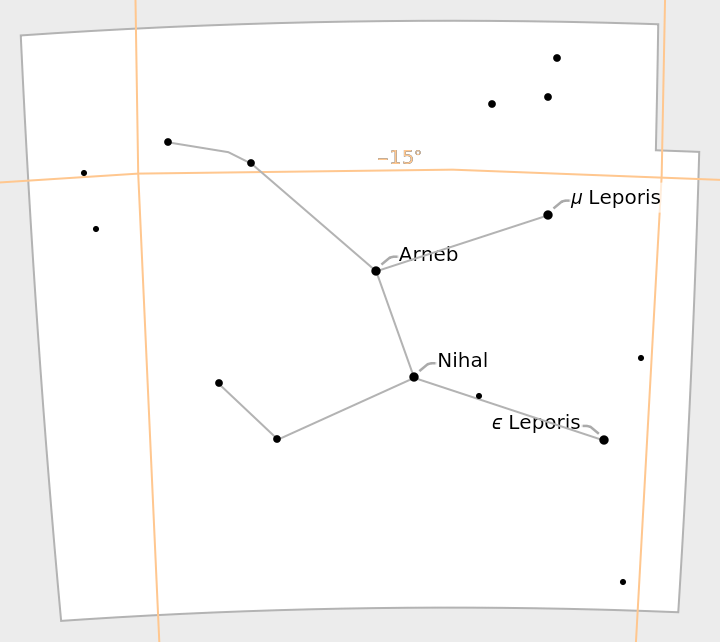 |
Stars can also be turned off:
| In[22]:= |
| Out[22]= | 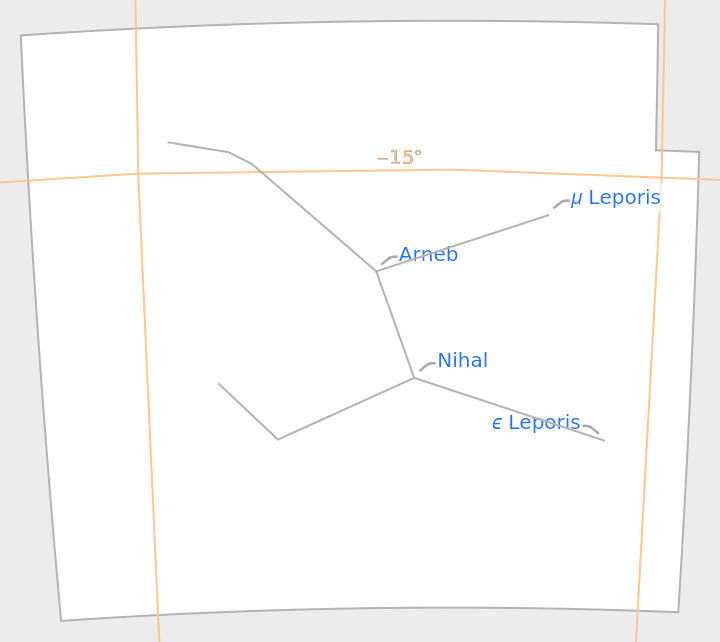 |
ConstellationChart can accept any of the 88 official IAU-recognized constellations found in the "Constellation" entity type:
| In[23]:= |
| Out[23]= | 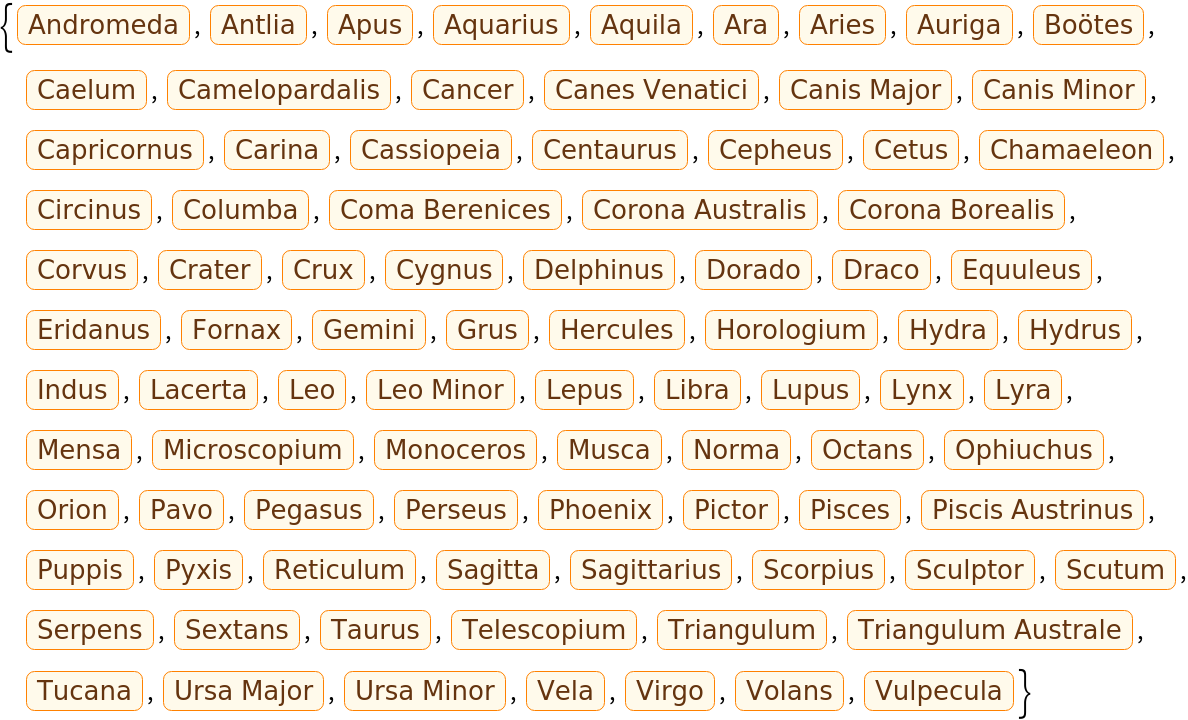 |
The current location of a given constellation in your local sky can be found using the resource function SkyChart:
| In[24]:= |
| Out[24]= | 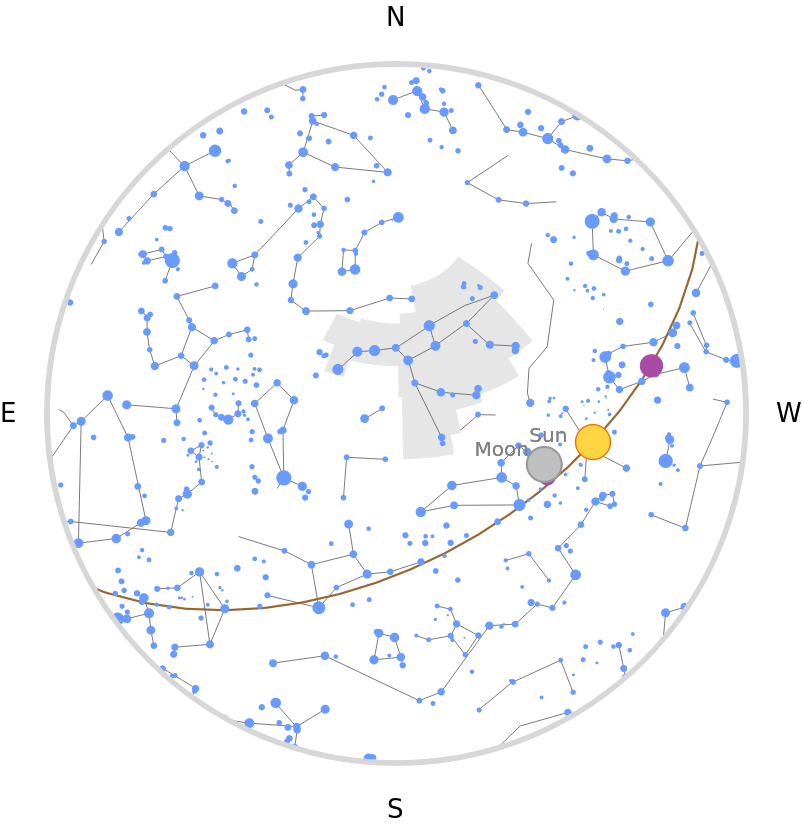 |
Additional properties of constellations can be found using the entity framework:
| In[25]:= |
| Out[25]= | 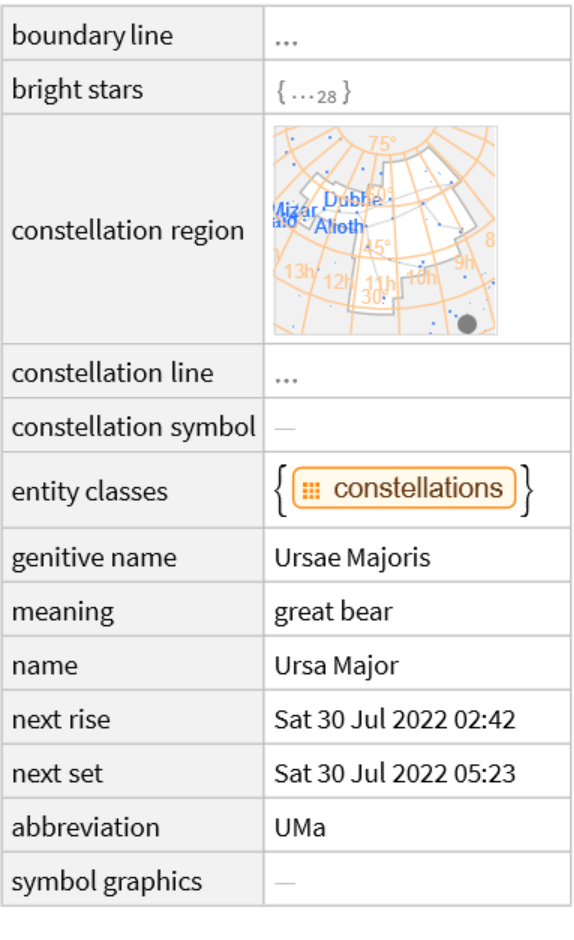 |
The "Constellation" entity type provides the "ConstellationGraphic" property with similar results to ConstellationChart, but ConstellationChart provides options for customizing the results more easily:
| In[26]:= |
| Out[26]= | 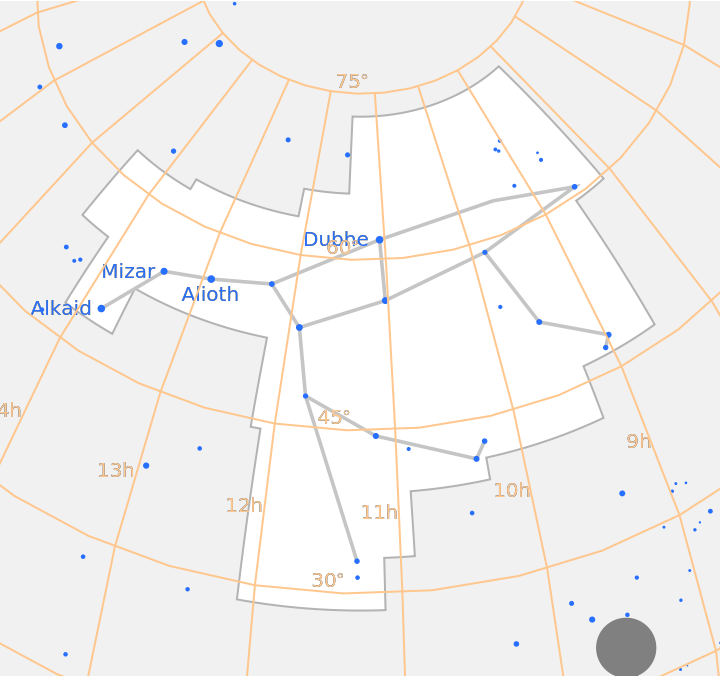 |
The constellation Serpens is made up of two disjoint regions:
| In[27]:= |
| Out[27]= | 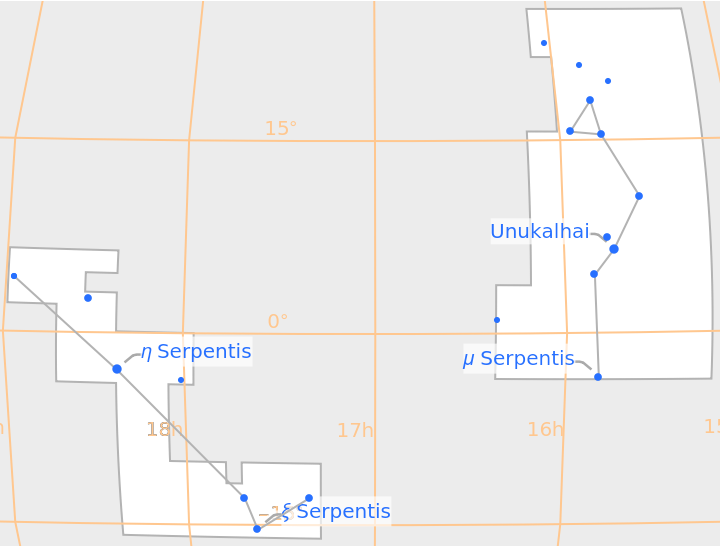 |
Create a darker themed result:
| In[28]:= | ![ResourceFunction["ConstellationChart"][
Entity["Constellation", "Sagittarius"], "MagnitudeLimit" -> 6.5, "BoundaryLineStyle" -> Directive[Dashing[{0, Tiny}], RGBColor[1, .8, 0]], "MaskRegionStyle" -> Black, "StarStyle" -> White, "HighlightedRegionStyle" -> Darker[Blue, .7], "GridStyle" -> Darker[Blue, .2]]](https://www.wolframcloud.com/obj/resourcesystem/images/e1d/e1d899ae-5b27-43c9-a419-8c11eec67d82/6e87495109be3ac8.png) |
| Out[28]= | 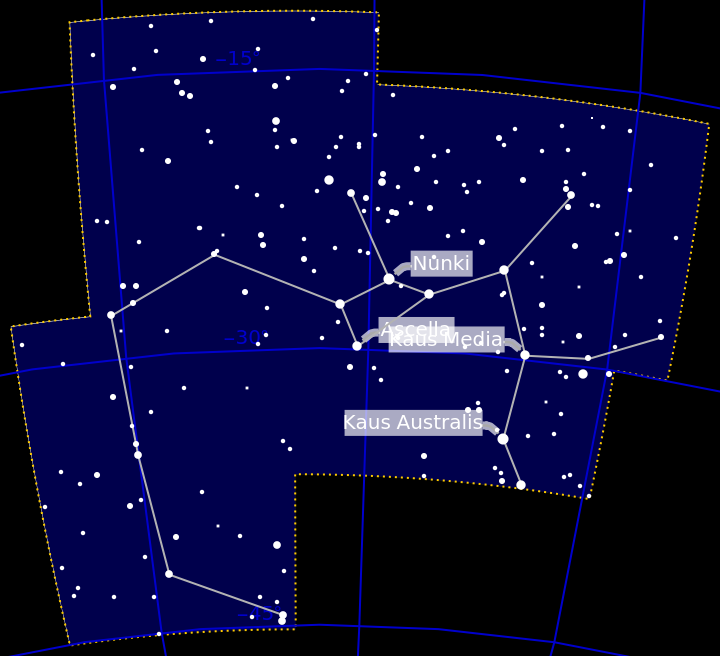 |
This work is licensed under a Creative Commons Attribution 4.0 International License