Wolfram Function Repository
Instant-use add-on functions for the Wolfram Language
Function Repository Resource:
Visualize the Eigenvectors of a 2 x 2 or 3 x 3 matrix
ResourceFunction["EigenvectorPlot"][m] visualizes the Eigenvectors of 2 x 2 or 3 x 3 matrix m. |
For 2 x 2 matrices, the vector field generated by left-multiplying by the matrix is displayed on the unit circle, together with dashed lines indicating the Eigenvectors. It can be observed that the vectors are perpendicular to the unit circle only at the Eigenvector lines:
| In[1]:= |
| Out[1]= | 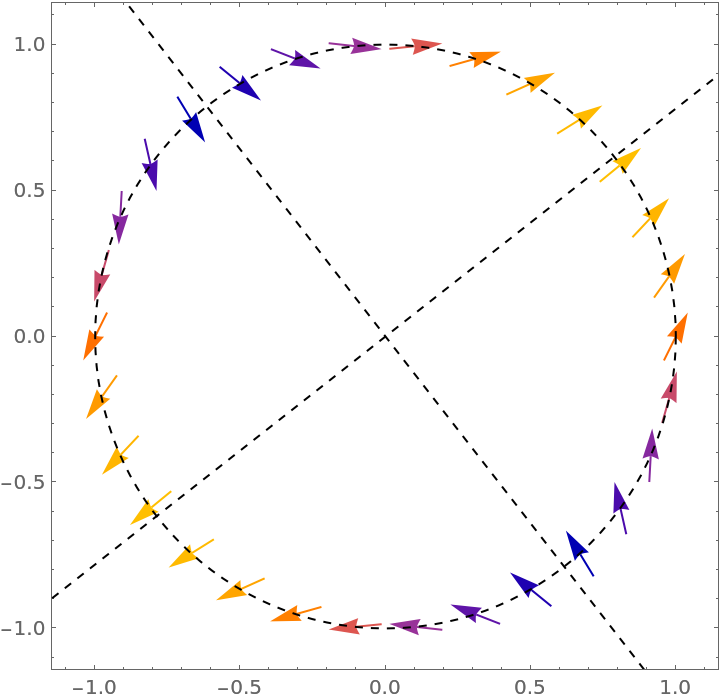 |
For 3 x 3 matrices, the vector field is plotted on the unit sphere:
| In[2]:= |
| Out[2]= | 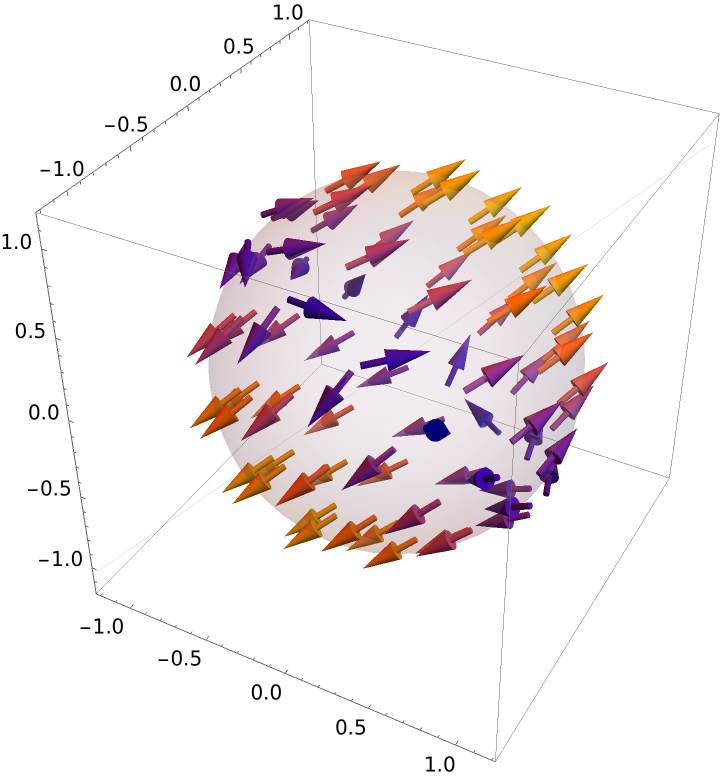 |
The relevant options for VectorPlot and VectorPlot3D can be used:
| In[3]:= |
| Out[3]= | 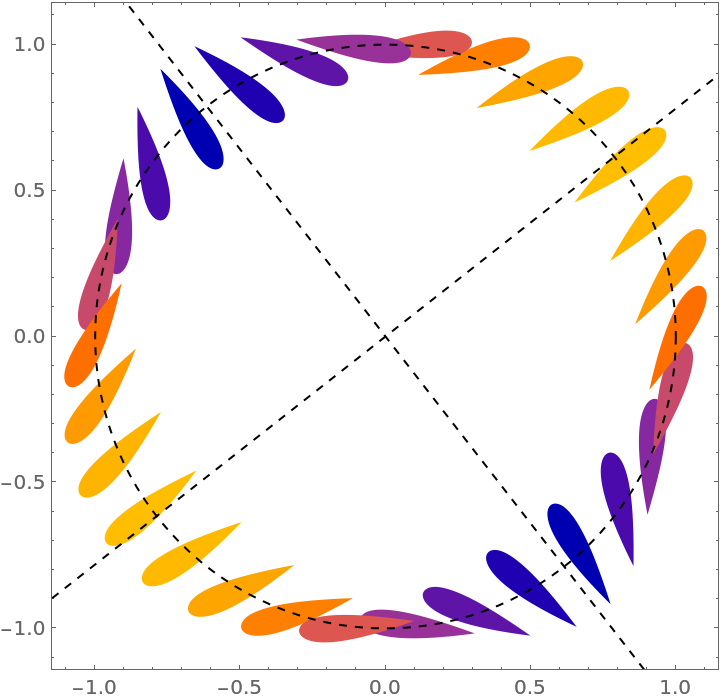 |
The VectorPoints option can only take the values Automatic, Coarse, Fine or an integer:
| In[4]:= |
| Out[4]= | 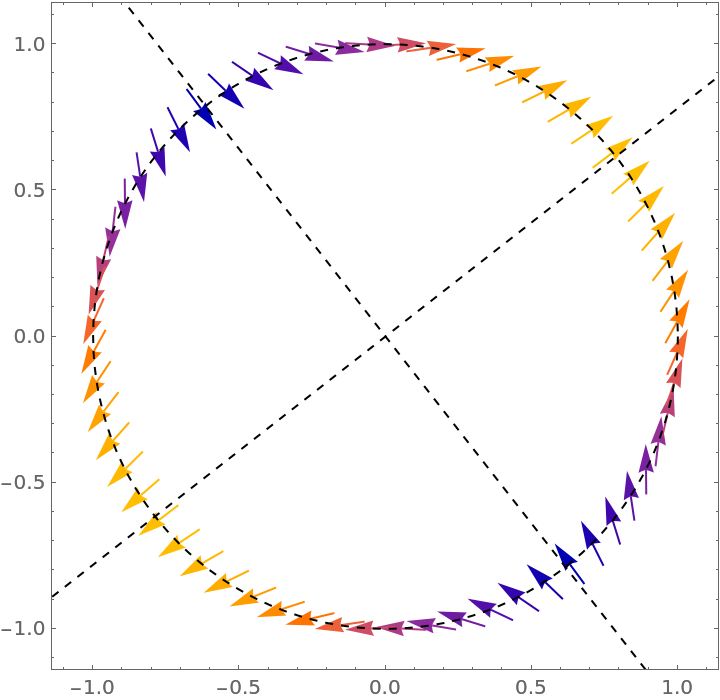 |
| In[5]:= |
| Out[5]= | 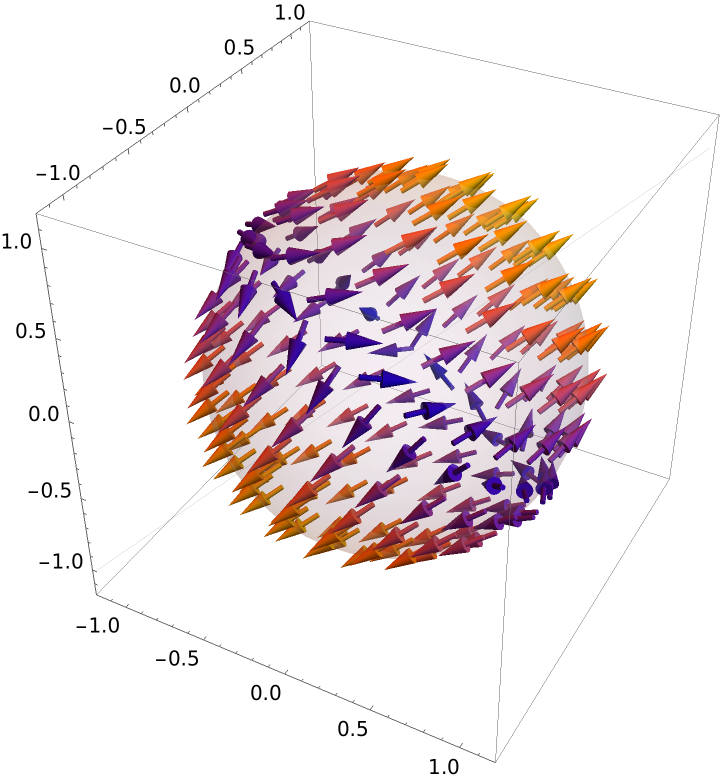 |
This work is licensed under a Creative Commons Attribution 4.0 International License