Wolfram Function Repository
Instant-use add-on functions for the Wolfram Language
Function Repository Resource:
Nicely format data in various structures into a grid format
ResourceFunction["NiceGrid"][data] formats data in a grid. | |
ResourceFunction["NiceGrid"][data,cols] formats data in a grid with column headers cols. | |
ResourceFunction["NiceGrid"][data,cols,rows] formats data in a grid with both column and row headers. |
Show array data in a grid preloaded with helpful options:
| In[1]:= |
| Out[1]= |
Add row and column headers:
| In[2]:= |
| Out[2]= | 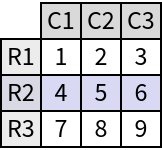 |
Easily display the contents of an Association in a grid with row headers:
| In[3]:= |
| Out[3]= |
Show a list of associations in a grid with column headers:
| In[4]:= |
| Out[4]= |
Show nested associations in a grid with both row and column headers:
| In[5]:= |
| Out[5]= | 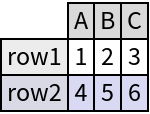 |
Use "MaxNumber" to limit the number of rows shown:
| In[6]:= |
| Out[6]= | 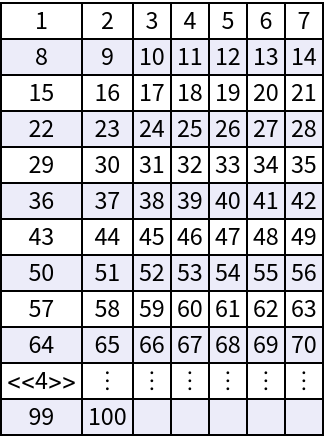 |
By default, "MaxNumber" is set to 50 to avoid overwhelming the Wolfram System and to show approximately one screen height of common text rows:
| In[7]:= |
| Out[7]= |  |
Use "MissingItem" to specify how grid elements that correspond to missing key-value pairs are displayed:
| In[8]:= |
| Out[8]= | 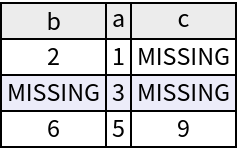 |
Add a number column to easily count rows:
| In[9]:= |
| Out[9]= |
The number column can be used with "MaxNumber":
| In[10]:= |
| Out[10]= | 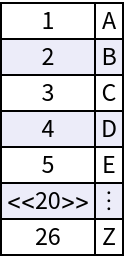 |
The number column gets a header if column headers are specified:
| In[11]:= |
| Out[11]= | 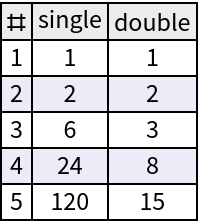 |
A number column can be added if row headers are not specified implicitly or explicitly:
| In[12]:= |
| Out[12]= | 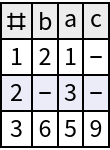 |
If row headers are specified, the option is ignored:
| In[13]:= |
| Out[13]= | 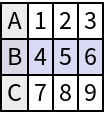 |
Import a file and view approximately a screenfull of its contents:
| In[14]:= |
| Out[15]= | 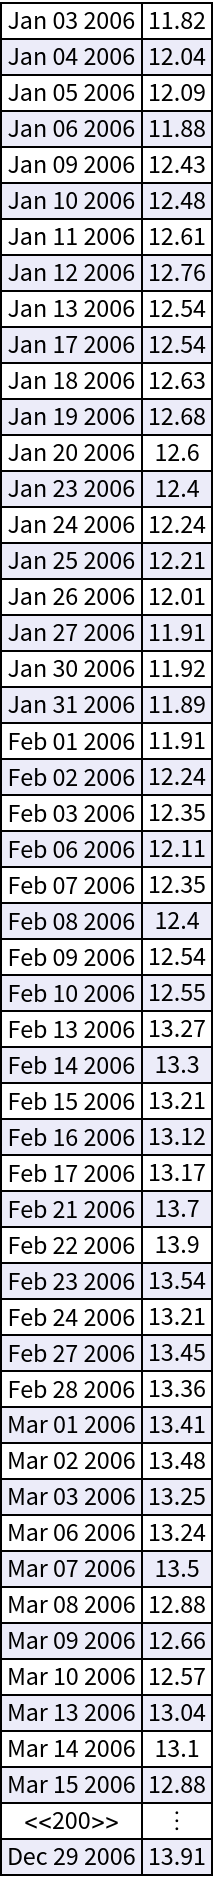 |
Options for Grid are supported:
| In[16]:= | ![ResourceFunction["NiceGrid"][
<|
"A" -> <|"a" -> "lorem", "b" -> "ipsum"|>,
"B" -> <|"a" -> "doror", "b" -> "sit"|>,
"C" -> <|"a" -> "amet", "b" -> "consectetur"|>
|>,
Alignment -> Left, Spacings -> 2
]](https://www.wolframcloud.com/obj/resourcesystem/images/d46/d46856e8-5702-4b8b-addf-d92743399b5f/072c53944d30f1fb.png) |
| Out[16]= | 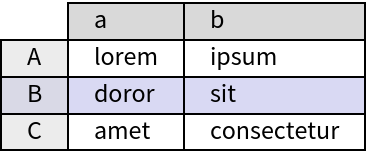 |
Dataset allows for dynamically navigating data with useful features like scrollbars:
| In[17]:= |
| In[18]:= |
| Out[18]= | 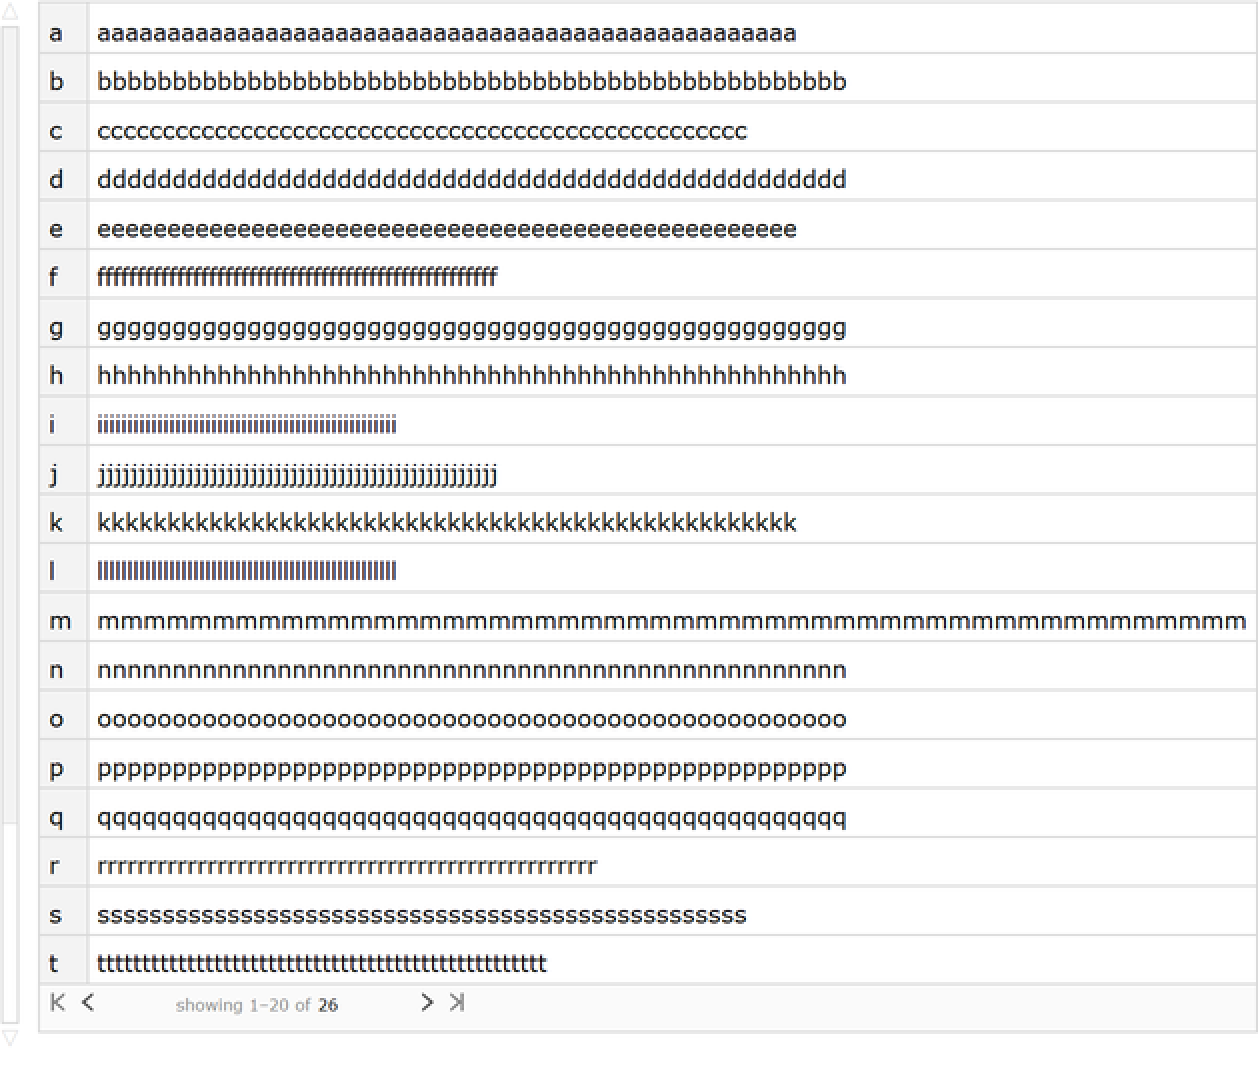 |
NiceGrid shows data more simply in a static form, typically with tighter rows and columns:
| In[19]:= |
| Out[19]= | 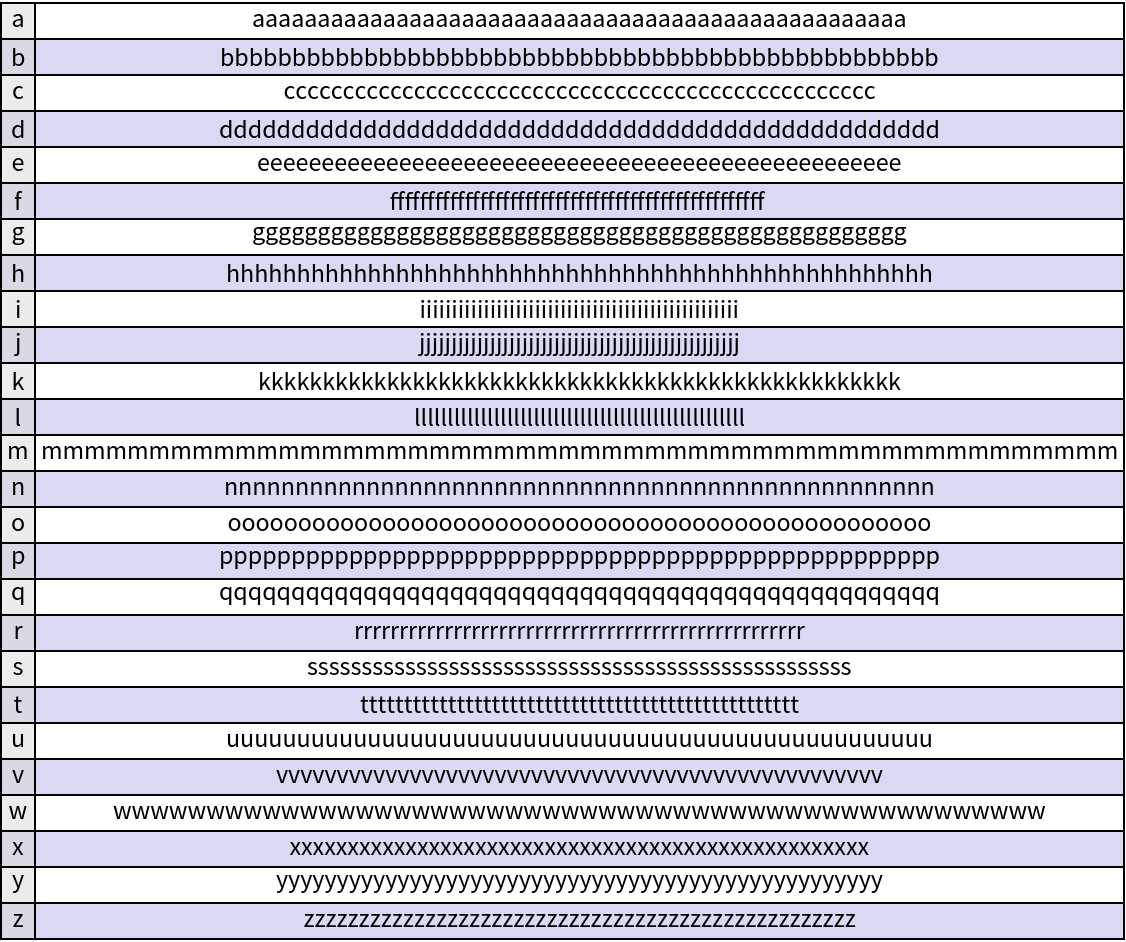 |
Dataset requires dynamic updating to display; NiceGrid does not:
| In[20]:= | ![CurrentValue[CellObject, DynamicUpdating] = False;
Rasterize /@ {Dataset[{1, 2, 3}], ResourceFunction["NiceGrid"][{1, 2, 3}]}
CurrentValue[CellObject, DynamicUpdating] = Automatic;](https://www.wolframcloud.com/obj/resourcesystem/images/d46/d46856e8-5702-4b8b-addf-d92743399b5f/2e1c10bb10c5d743.png) |
| Out[21]= | 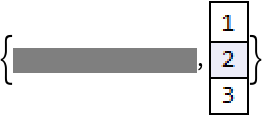 |
Nonuniform data can lead to undesirable formatting:
| In[22]:= | ![data = <|"A" -> <|"a" -> 1, "b" -> 2|>, "B" -> <|"a" -> 3, "b" -> 4|>,
"C" -> <|"a" -> 5, "b" -> 6, "c" -> 3|>|>;
ResourceFunction["NiceGrid"][data]](https://www.wolframcloud.com/obj/resourcesystem/images/d46/d46856e8-5702-4b8b-addf-d92743399b5f/60dd54494c1636ca.png) |
| Out[23]= | 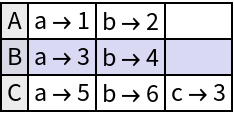 |
Normalize the data to get better formatting:
| In[24]:= |
| Out[24]= | 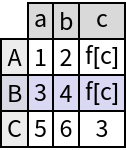 |
Nested data may have undesirable formatting:
| In[25]:= | ![nestedData = <|
"A" -> <|"i" -> "one", "ii" -> "two"|>,
"B" -> <|"iii" -> "three", "iv" -> "four", "v" -> "five"|>,
"C" -> <|"vi" -> "six", "vii" -> "seven", "viii" -> "eight"|>
|>;
ResourceFunction["NiceGrid"][nestedData]](https://www.wolframcloud.com/obj/resourcesystem/images/d46/d46856e8-5702-4b8b-addf-d92743399b5f/7085b6655ac82054.png) |
| Out[26]= | 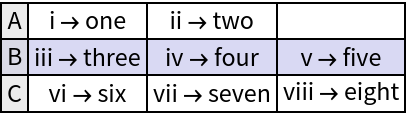 |
Using NiceGrid at different levels may give better results:
| In[27]:= |
| Out[27]= | 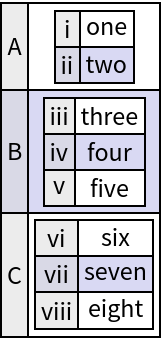 |
Gather a large dataset with images and show a small portion of it:
| In[28]:= | ![data = EntityValue[
EntityClass["FoodType", "CommonOutsideColor" -> "Green"],
{"Image", "ApproximateShape", "CommonInsideColor", "DefaultServingSizeMass"},
"EntityPropertyAssociation"
];
ResourceFunction["NiceGrid"][data, "MaxNumber" -> 5]](https://www.wolframcloud.com/obj/resourcesystem/images/d46/d46856e8-5702-4b8b-addf-d92743399b5f/2c63d3bdcb05977f.png) |
| Out[28]= | 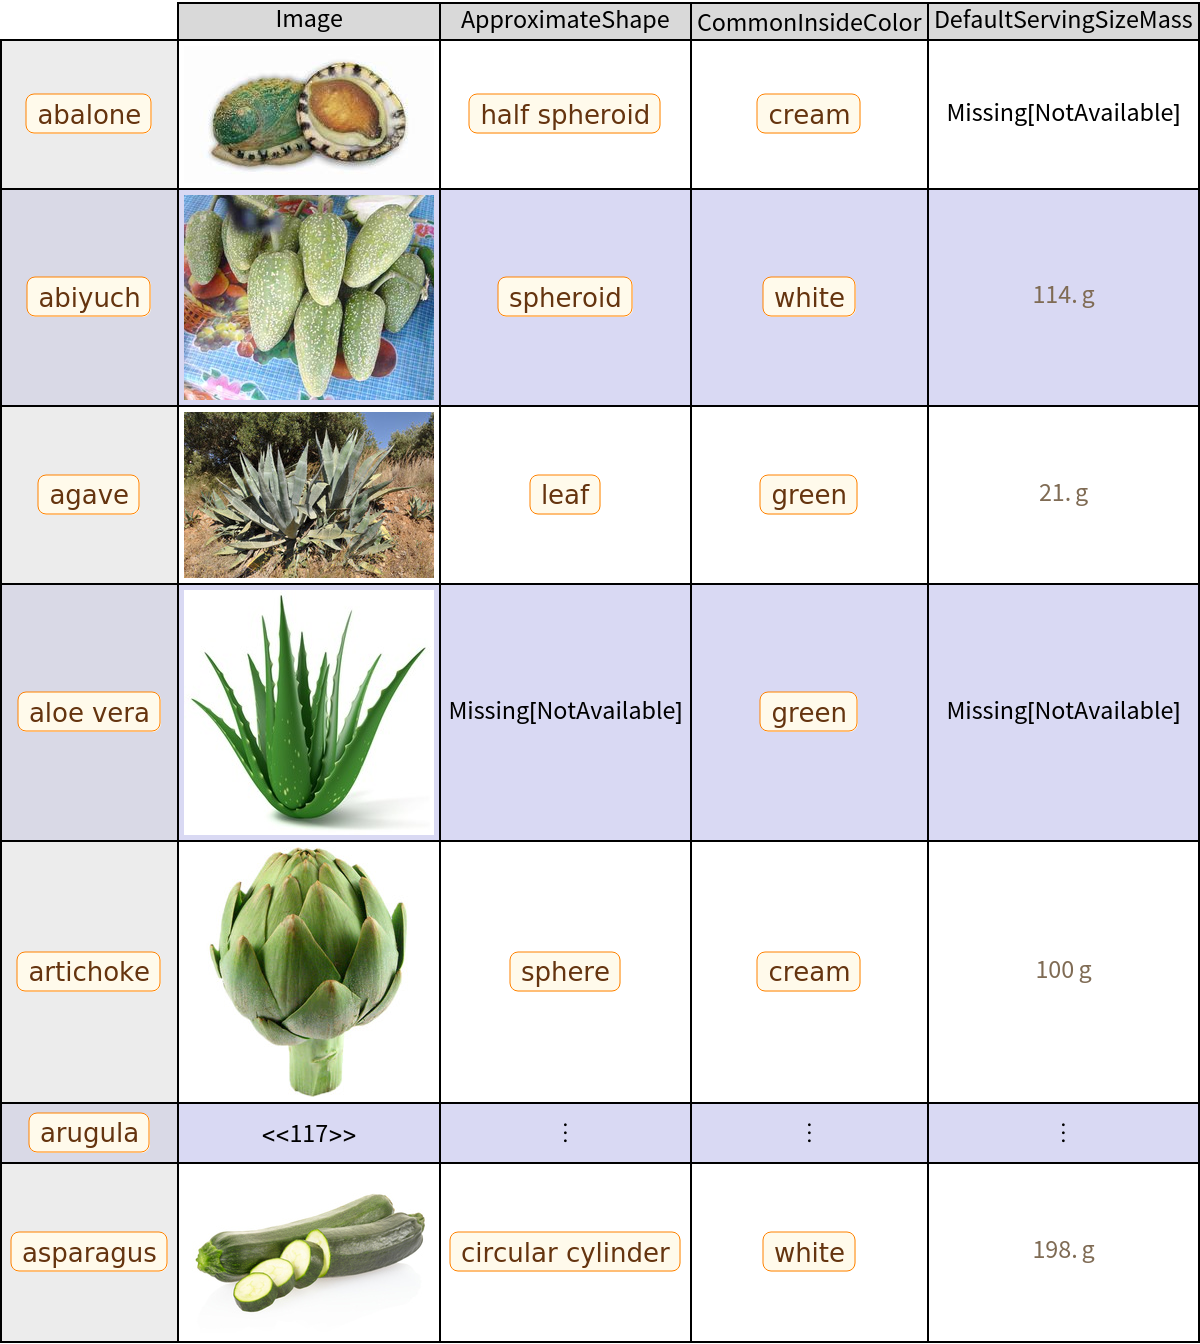 |
This work is licensed under a Creative Commons Attribution 4.0 International License