Wolfram Function Repository
Instant-use add-on functions for the Wolfram Language
Function Repository Resource:
Visualize the autocorrelation of data
ResourceFunction["Correlogram"][data] plots the autocorrelation of data. |
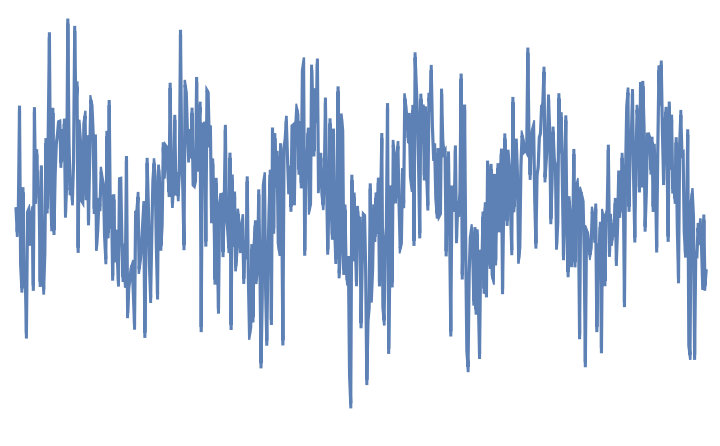
Noisy data with an underlying sine wave does not appear to have any structure:
| In[1]:= |
| Out[2]= | 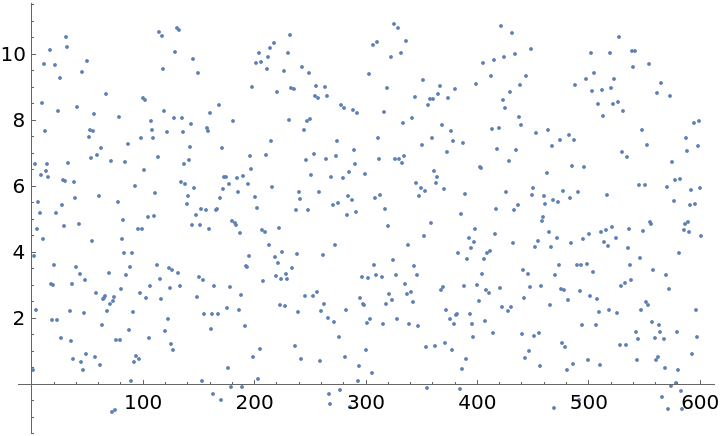 |
The correlogram reveals the hidden periodic signal:
| In[3]:= |
| Out[3]= | 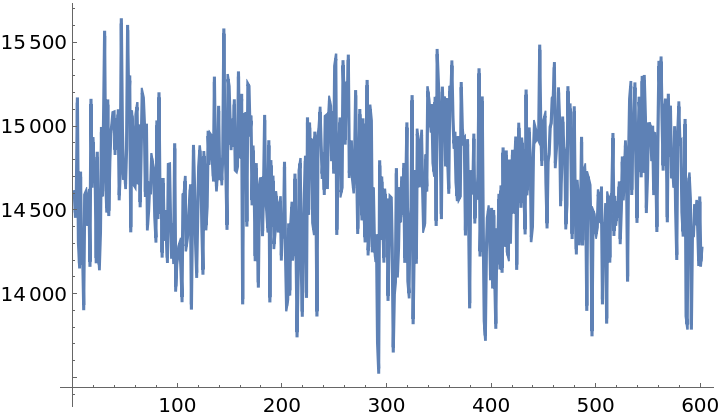 |
Wolfram Language 11.3 (March 2018) or above
This work is licensed under a Creative Commons Attribution 4.0 International License