Wolfram Function Repository
Instant-use add-on functions for the Wolfram Language
Function Repository Resource:
Plot the ground track and position of artificial satellites
ResourceFunction["SatelliteGroundTrackPlot"][entity] plots the current ground track and position of the satellite specified by entity. | |
ResourceFunction["SatelliteGroundTrackPlot"][entity,date] plots the ground track and position on the specified date. |
| GeoRange | All | geographic area range to include |
| "GroundTrackStyle" | Automatic | directive used to style the ground track of satellites |
| "IncludeLegend" | Automatic | whether to include a legend for the displayed satellites |
| "SatelliteStyle" | Automatic | directive used to style the position of satellites |
| "VisibleRegion" | True | whether to display regions from which the satellite is visible |
Plot the current ground track of the International Space Station:
| In[1]:= |
| Out[1]= | 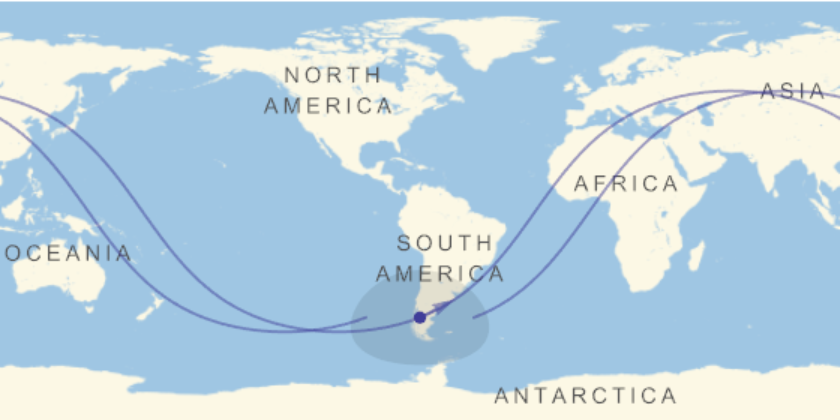 |
Plot the ground track of a satellite at a specified date and time:
| In[2]:= |
| Out[2]= | 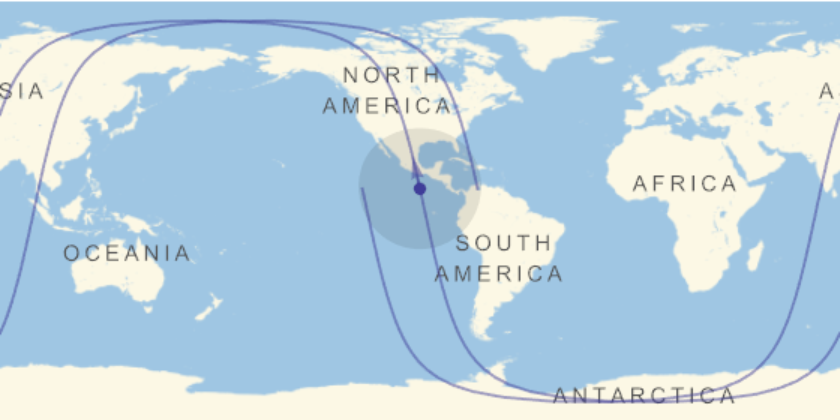 |
Plot the current ground track of multiple satellites:
| In[3]:= | ![ResourceFunction[
"SatelliteGroundTrackPlot"][{Entity["Satellite", "25544"], Entity["Satellite", "25260"], Entity["Satellite", "25994"]}]](https://www.wolframcloud.com/obj/resourcesystem/images/d05/d05c1ac7-50af-4eb6-940c-14d0209735fc/42ebdf28d818c748.png) |
| Out[3]= | 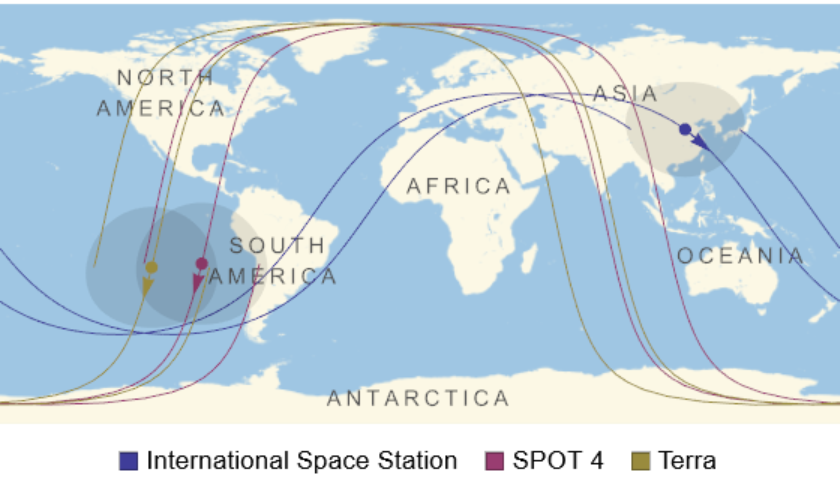 |
Plot the ground track of a satellite at a specific date and time:
| In[4]:= |
| Out[4]= | 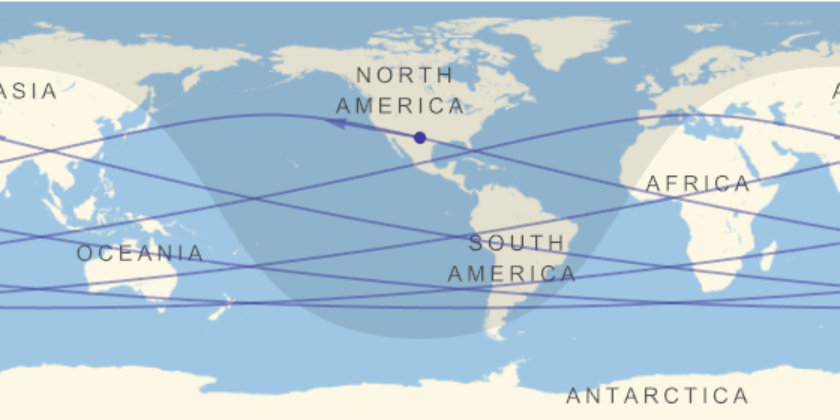 |
Plot the ground track of a decayed satellite:
| In[5]:= |
| Out[5]= |  |
Plot the ground tracks of entity classes of satellites:
| In[6]:= |
| Out[6]= | 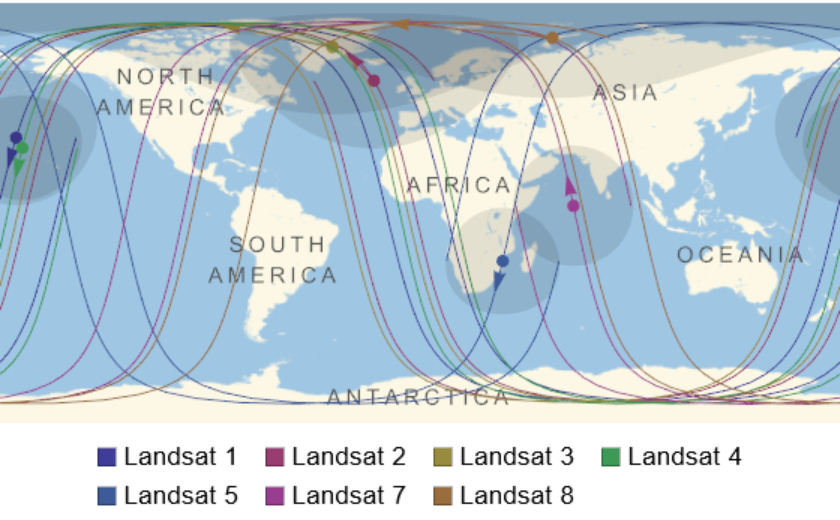 |
Change the color of the ground track and satellite position indicator:
| In[7]:= | ![ResourceFunction["SatelliteGroundTrackPlot"][
Entity["Satellite", "25544"], "GroundTrackStyle" -> Black, "SatelliteStyle" -> Directive[Opacity[1], Red, PointSize[.015]]]](https://www.wolframcloud.com/obj/resourcesystem/images/d05/d05c1ac7-50af-4eb6-940c-14d0209735fc/66c1d839fe35a8d2.png) |
| Out[7]= | 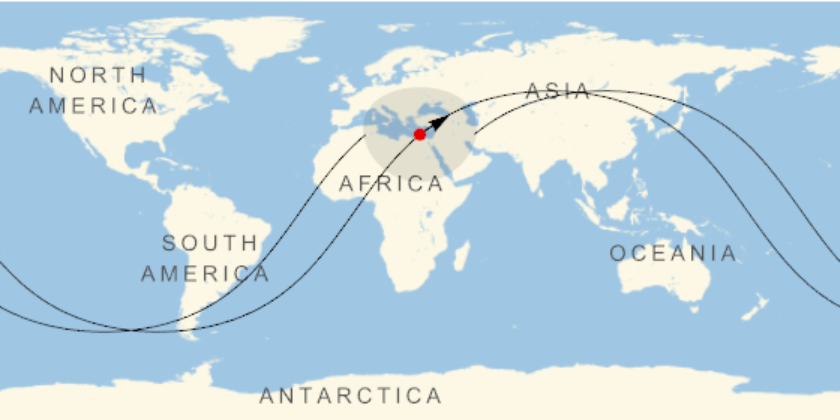 |
For a large number of satellites, the legend and visible regions can be distracting so they can be turned off:
| In[8]:= | ![ResourceFunction["SatelliteGroundTrackPlot"][
EntityClass["Satellite", "GPS"], "IncludeLegend" -> False, "VisibleRegion" -> False]](https://www.wolframcloud.com/obj/resourcesystem/images/d05/d05c1ac7-50af-4eb6-940c-14d0209735fc/44242c88ea71fe36.png) |
| Out[8]= | 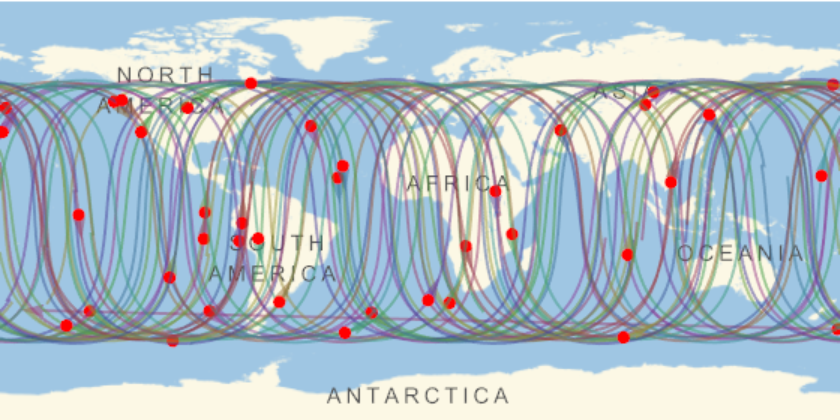 |
Combine options from GeoGraphics with options specific to SatelliteGroundTrackPlot:
| In[9]:= | ![ResourceFunction["SatelliteGroundTrackPlot"][
Entity["Satellite", "35491"], GeoProjection -> "Orthographic", GeoZoomLevel -> 2, GeoBackground -> "Satellite", "SatelliteStyle" -> Directive[Red, Opacity[1], PointSize[.015]], "GroundTrackStyle" -> Opacity[0]]](https://www.wolframcloud.com/obj/resourcesystem/images/d05/d05c1ac7-50af-4eb6-940c-14d0209735fc/26e17c2ecc5bd5a5.png) |
| Out[9]= | 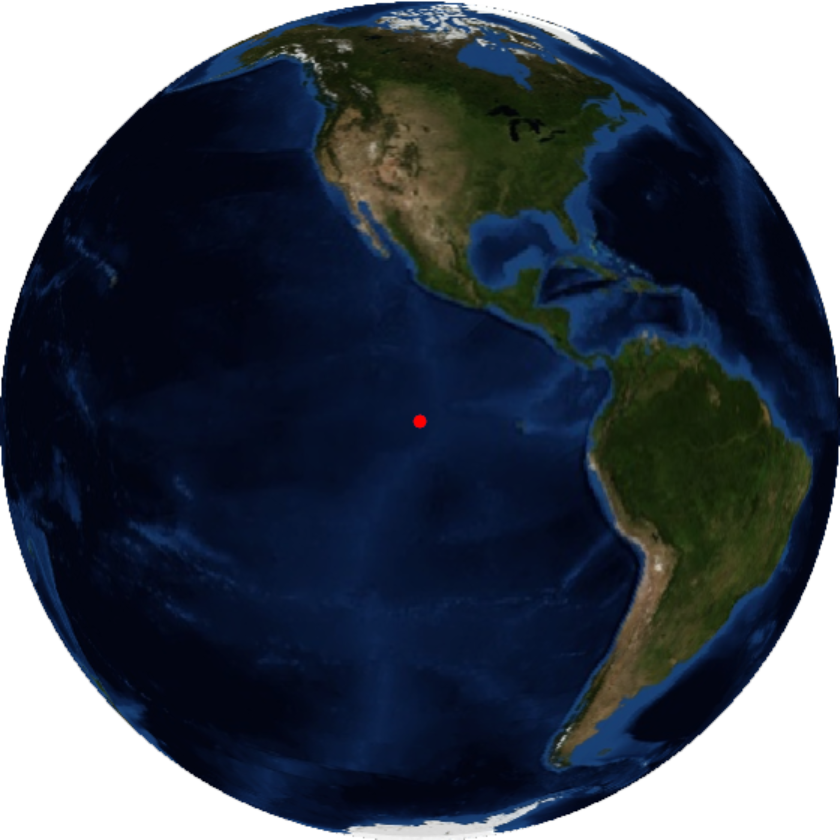 |
Create highly stylized ground track plots:
| In[10]:= | ![ResourceFunction["SatelliteGroundTrackPlot"][
Entity["Satellite", "25544"], DateObject[{2018, 12, 18, 12, 55}, "Minute", "Gregorian", -6.`],
"SatelliteStyle" -> Directive[Opacity[1], Red, PointSize[.05]],
"GroundTrackStyle" -> Directive[GrayLevel[1], Dashed, Thickness[.02], CapForm["Butt"]],
"VisibleRegionStyle" -> GeoStyling[
Directive[Opacity[.4], RGBColor[1, 0.5, 0], StrokeForm[RGBColor[1, 0, 0]]]],
GeoRange -> {{-70, 40}, {-150, -65}}, GeoProjection -> {"VerticalPerspective", "Centering" -> {64.5, -74, 1.725}}, GeoGridLines -> Quantity[5, "AngularDegrees"], GeoGridLinesStyle -> Directive[Opacity[0.5], GrayLevel[1]], GeoRangePadding -> Full, GeoBackground -> GeoStyling["ReliefMap"], Background -> Hue[0.6, 1, 0.2], PlotRangePadding -> {{0.03, 0}, {0.05, 0}}]](https://www.wolframcloud.com/obj/resourcesystem/images/d05/d05c1ac7-50af-4eb6-940c-14d0209735fc/6d126e35740312c2.png) |
| Out[10]= | 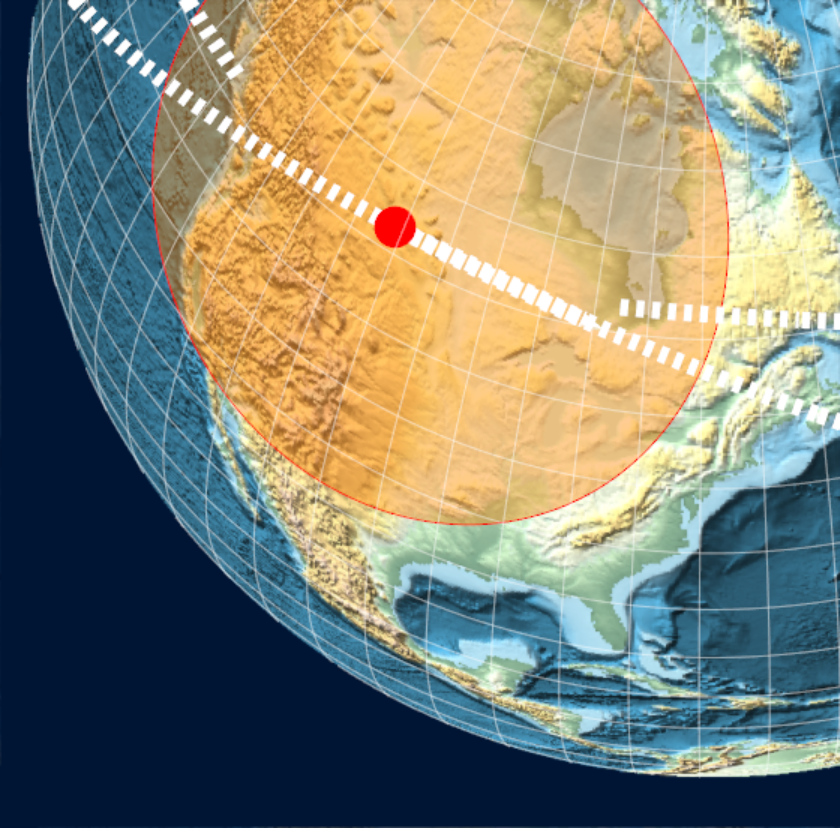 |
This work is licensed under a Creative Commons Attribution 4.0 International License