Basic Examples (2)
Get the Total of the "Second" column with a common name in the "First" column:
Example dataset with labels in the first rows:
List all unique values in the column "City" and sum the corresponding numeric values in "Item 1" using Total:
Perform the same calculation, but format in a grid with TextGrid:
List all unique values in the column "City" and sum the corresponding numeric values in "Item 2" using Total; use TextGrid in postfix form:
List all unique values common to both the "City" and "State" columns and sum the corresponding numeric values in "Item 1" using Total:
List all unique values common to both the "City" and "State" columns and sum the corresponding numeric values in "Item 2" using Total:
Scope (6)
Example dataset with labels in the first rows:
List all unique values common to both the "City" and "State" columns and count the corresponding numeric values in "Item 2" using Length:
List all unique values common to both the "City" and "State" columns and count the corresponding numeric values in "Item 1" using Length:
Perform the same calculation, with additional options for TextGrid to add a gray frame:
Perform the same calculation, with different columns and Total to sum values in "Item 1":
Although strings are commonly binned with pivot tables, numeric values can be used as well:
Applications (2)
Example dataset with labels in the first rows:
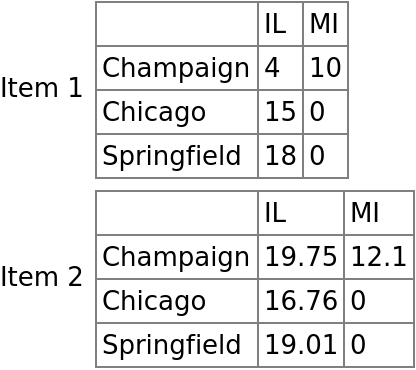
Make a Table of pivot tables to compare values:
Example dataset with labels in the first rows:
Perform a simple pivot table and export the resulting list:
Neat Examples (2)
Example dataset with labels in the first rows:
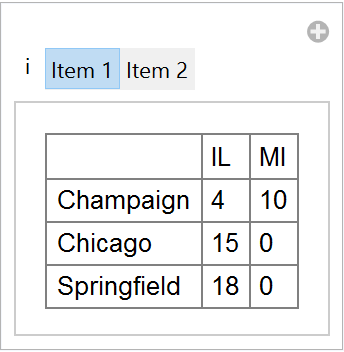
Make a Manipulate with varying column values for a pivot table:
Create a pivot table for a large dataset; first create a large test dataset:
Import the test dataset with 1.2 million rows and 4 columns:
Create a pivot table based on the large dataset:


![TextGrid[
ResourceFunction["PivotTable"][dat, "City", "Item 1", Total]
]](https://www.wolframcloud.com/obj/resourcesystem/images/cec/cecdb146-f279-4218-a685-39ba8ad5d1aa/5e63b098dc28b55b.png)


![TextGrid[ResourceFunction["PivotTable"][dat, "City", "State", "Item 2", Length], Frame -> All, FrameStyle -> Directive[Gray]]](https://www.wolframcloud.com/obj/resourcesystem/images/cec/cecdb146-f279-4218-a685-39ba8ad5d1aa/2df109208f1dd742.png)
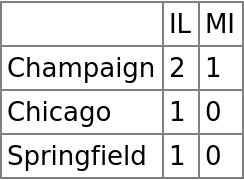
![TextGrid[ResourceFunction["PivotTable"][dat, "City", "State", "Item 1", Total], Frame -> All, FrameStyle -> Directive[Gray]]](https://www.wolframcloud.com/obj/resourcesystem/images/cec/cecdb146-f279-4218-a685-39ba8ad5d1aa/0d0b36287e60dcec.png)


![Table[{
i,
TextGrid[
ResourceFunction["PivotTable"][dat, "City", "State", i, Total], Frame -> All, FrameStyle -> Directive[Gray]]},
{i, {"Item 1", "Item 2"}}
] // TextGrid](https://www.wolframcloud.com/obj/resourcesystem/images/cec/cecdb146-f279-4218-a685-39ba8ad5d1aa/37a110d8cffda505.png)


![Manipulate[
TextGrid[
ResourceFunction["PivotTable"][dat, "City", "State", i, Total], Frame -> All, FrameStyle -> Directive[Gray]],
{i, {"Item 1", "Item 2"}},
SaveDefinitions -> True
]](https://www.wolframcloud.com/obj/resourcesystem/images/cec/cecdb146-f279-4218-a685-39ba8ad5d1aa/4c940fc7175c24d4.png)
![values1 = {"Mercury", "Venus", "Earth", "Mars", "Jupiter", "Saturn", "Uranus", "Neptune"};
values2 = {"One", "Two", "Three", "Four"};
planets = Prepend[
Table[{
RandomChoice[values1],
RandomChoice[values2],
RandomReal[],
RandomReal[]
},
{i, 1200000}
],
{"Planet", "Quarter", "Value 1", "Value 2"}
];](https://www.wolframcloud.com/obj/resourcesystem/images/cec/cecdb146-f279-4218-a685-39ba8ad5d1aa/15793a2cadd8a521.png)
