Wolfram Function Repository
Instant-use add-on functions for the Wolfram Language
Function Repository Resource:
Plot an array of digits, allowing them to be ragged on the left
ResourceFunction["RaggedDigitsPlot"][list] plots the list of binary digit sequences in list, showing them as ragged on the left. | |
ResourceFunction["RaggedDigitsPlot"][list,b] assumes digits in base b. | |
ResourceFunction["RaggedDigitsPlot"][list,b,n] uses n digits of padding on the left. |
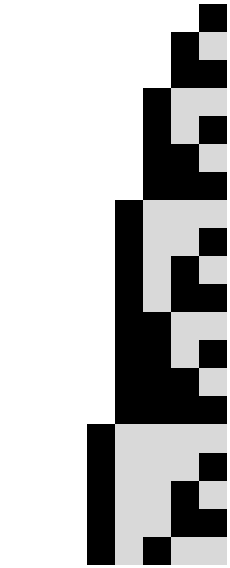
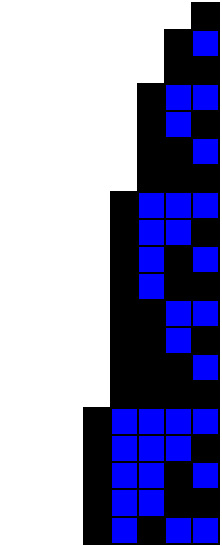
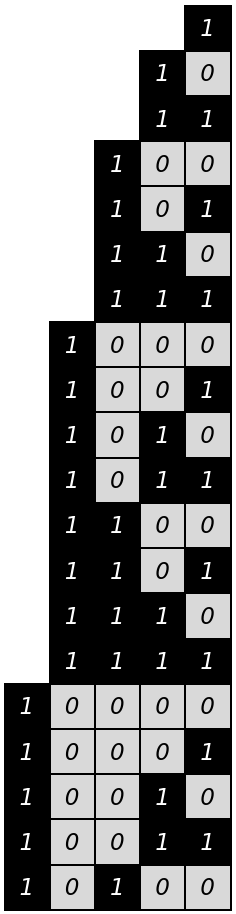
Plot binary digit sequences of successive numbers:
| In[1]:= |
|
| Out[1]= |
|
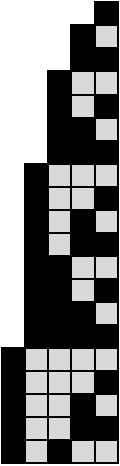
Plot ternary digit sequences:
| In[2]:= |
|
| Out[2]= |
|
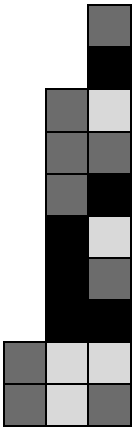
Include padding equivalent to three digit positions on the left:
| In[3]:= |
|
| Out[3]= |
|
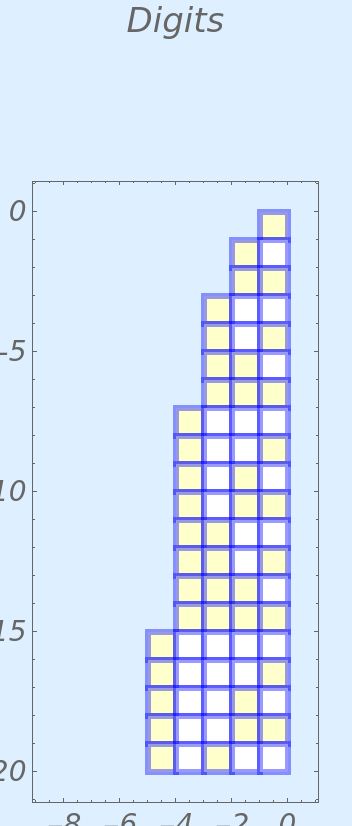
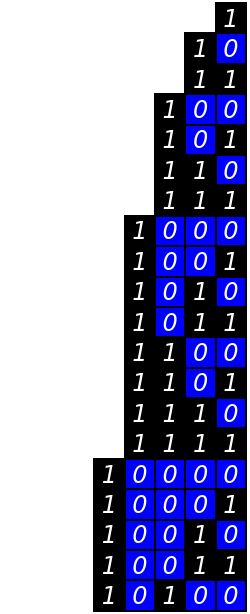
Customize the appearance of the plot:
| In[4]:= |
![ResourceFunction["RaggedDigitsPlot"][
Table[IntegerDigits[n, 2], {n, 20}], 2, 3, Background -> LightBlue, ColorFunction -> ColorData["WebSafe"], MeshStyle -> Directive[Blue, Opacity[0.4], Thickness[.02]], Frame -> True, PlotLabel -> "Digits", PlotRangePadding -> 1]](https://www.wolframcloud.com/obj/resourcesystem/images/ca4/ca4266b5-fbc2-4ff5-8c86-2d2aff6286f0/0e9c01aa5e28d9f5.png)
|
| Out[4]= |
|
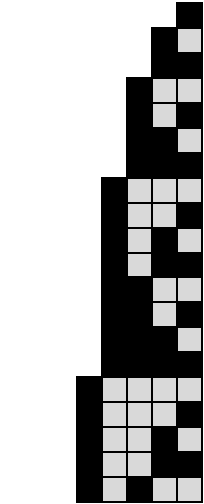
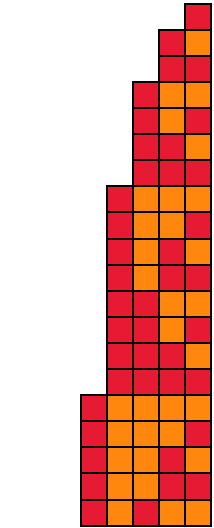
Select color maps:
| In[5]:= |
|
| Out[5]= |
|
| In[6]:= |
|
| Out[6]= |
|
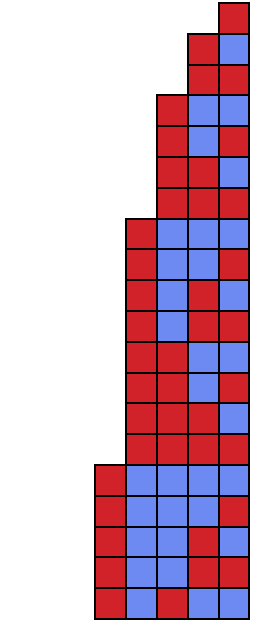
Specify individual colors for values:
| In[7]:= |
|
| Out[7]= |
|
| In[8]:= |
|
| Out[8]= |
|
Add labels to the cells:
| In[9]:= |
|
| Out[9]= |
|
| In[10]:= |
|
| Out[10]= |
|
Wolfram Language 11.3 (March 2018) or above
This work is licensed under a Creative Commons Attribution 4.0 International License