Wolfram Function Repository
Instant-use add-on functions for the Wolfram Language
Function Repository Resource:
Visually classify soil sample types by their relative sand, silt and clay contents
ResourceFunction["SoilTexturePlot"][] plots the standard USDA soil texture diagram. | |
ResourceFunction["SoilTexturePlot"][samples] plots a soil texture diagram overlaid with points samples, with soil samples provided in the format {sand,clay,silt}. |
| Soil type | RGB values |
| "Silt" | {0,256,0} |
| "Silty clay loam" | {37,204,135} |
| "Silty clay" | {106,256,191} |
| "Silt loam" | {126,203,0} |
| "Clay loam" | {181,256,48} |
| "Loam" | {206,137,0} |
| "Sandy clay" | {256,0,0} |
| "Sandy clay loam" | {256,128,136} |
| "Sandy loam" | {256,189,256} |
| "Loamy sand" | {256,191,195} |
| "Sand" | {256,193,131} |
| "Clay" | {256,256,125} |
Plot the standard USDA soil texture diagram:
| In[1]:= |
| Out[1]= | 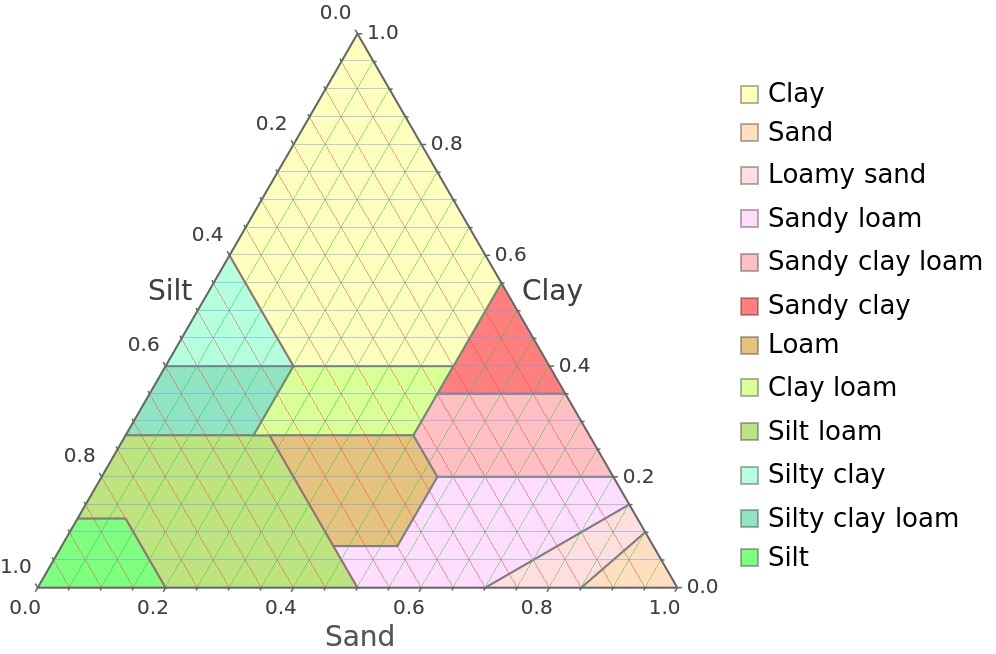 |
Visually classify a single soil sample with the given relative quantities on the soil texture diagram:
| In[2]:= |
| Out[2]= | 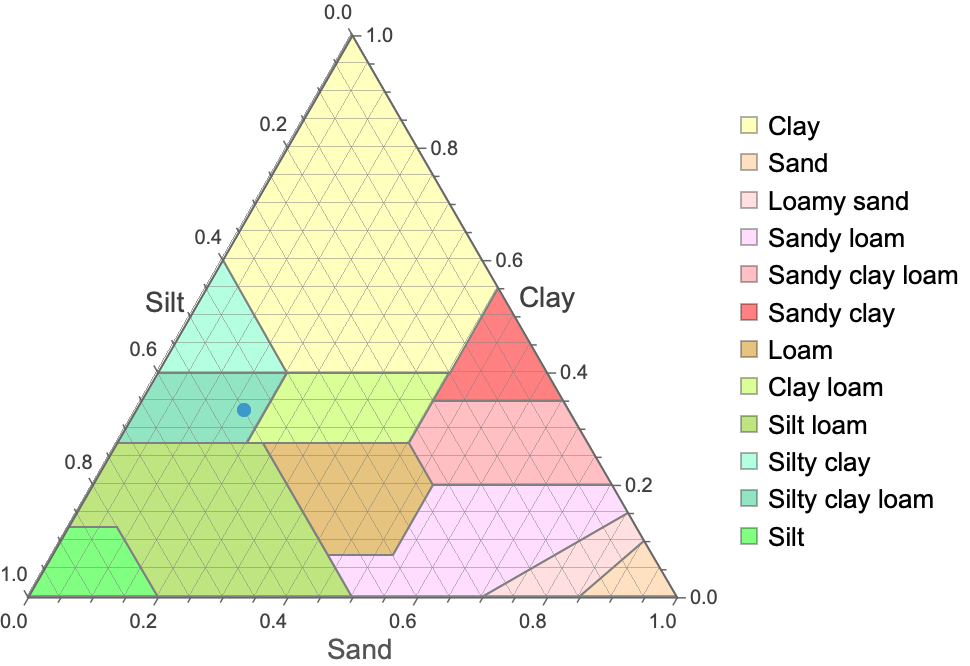 |
Overlay soil samples on the soil texture diagram:
| In[3]:= | ![ResourceFunction["SoilTexturePlot"][{
{(*Sand:*).3,(*Clay:*).3,(*Silt:*).4},
{0.38`, 0.16`, 0.46`}, {0.69, 0.17, 0.14},
{0.17, 0.53, 0.31}, {0.25, 0.36, 0.39}}]](https://www.wolframcloud.com/obj/resourcesystem/images/c74/c744c80f-9107-492f-a8b6-74eb88b0c3f1/4db72af267eec46c.png) |
| Out[3]= | 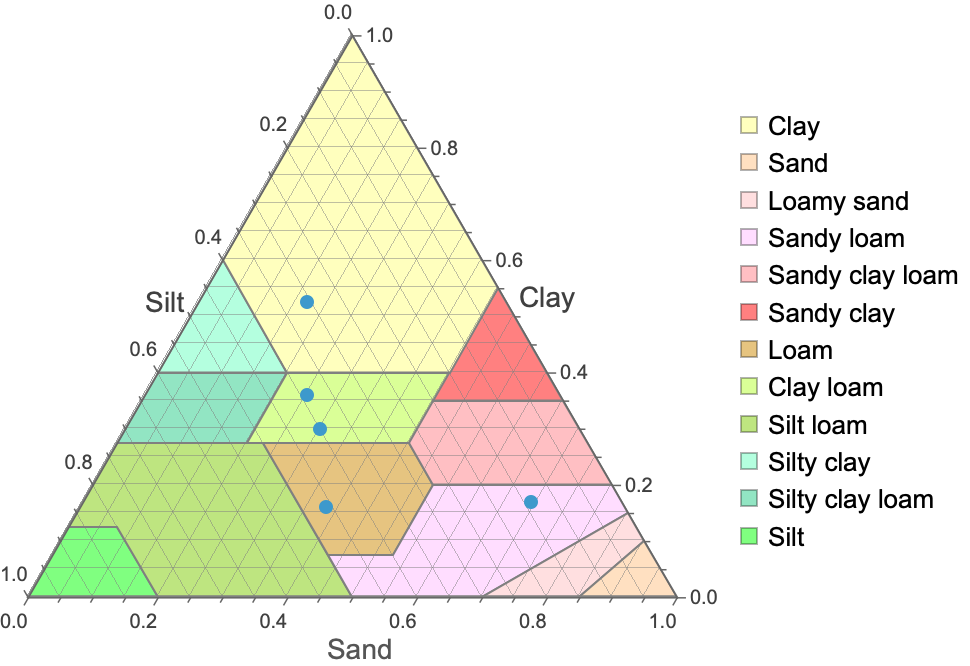 |
By default, the diagram is plotted with grid lines (GridLines→True):
| In[4]:= |
| Out[4]= |  |
Plot the soil texture diagram without grid lines:
| In[5]:= |
| Out[5]= | 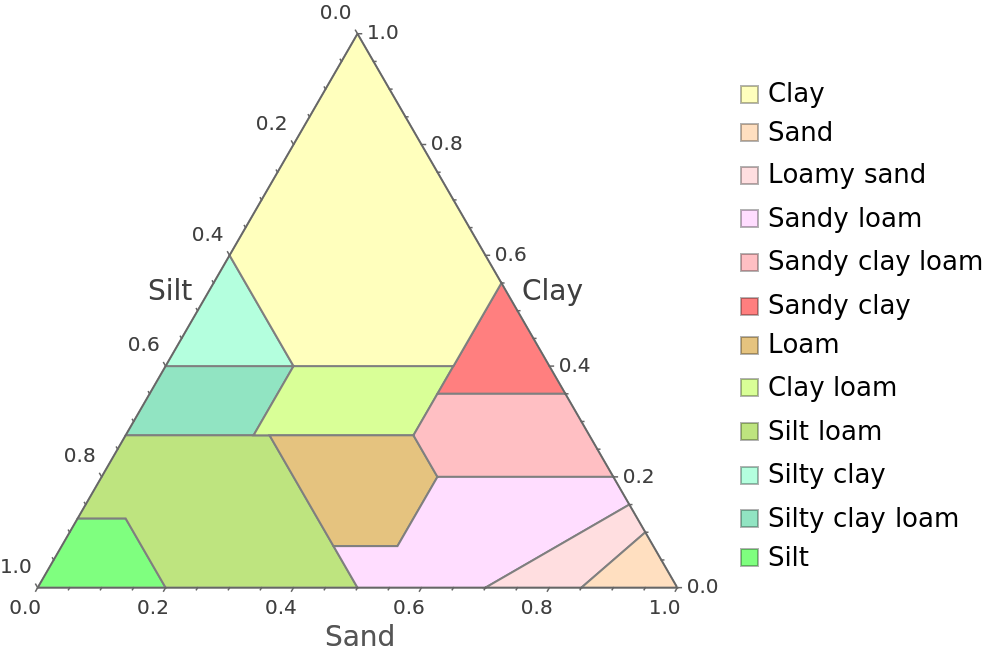 |
Plot the soil texture diagram with custom grid lines, following the grid line specification conventions of TernaryListPlot:
| In[6]:= | ![ResourceFunction["SoilTexturePlot"][GridLines -> {
{{0.`, Opacity[0.5`, RGBColor[0.14, 0.8, 0.14]]}, {0.2`, Opacity[0.5`, RGBColor[0.14, 0.8, 0.14]]}, {0.4`, Opacity[0.5`, RGBColor[0.14, 0.8, 0.14]]}, {0.6`, Opacity[0.5`, RGBColor[0.14, 0.8, 0.14]]}, {0.8`, Opacity[0.5`, RGBColor[0.14, 0.8, 0.14]]}, {1.`, Opacity[0.5`, RGBColor[0.14, 0.8, 0.14]]}},
{{0.`, Opacity[0.5`, RGBColor[0.4, 0.6, 1]]}, {0.2`, Opacity[0.5`, RGBColor[0.4, 0.6, 1]]}, {0.4`, Opacity[0.5`, RGBColor[0.4, 0.6, 1]]}, {0.6`, Opacity[0.5`, RGBColor[0.4, 0.6, 1]]}, {0.8`, Opacity[0.5`, RGBColor[0.4, 0.6, 1]]}, {1.`, Opacity[0.5`, RGBColor[0.4, 0.6, 1]]}},
{{0.`, Opacity[0.5`, RGBColor[0.93, 0.27, 0.27]]}, {0.2`, Opacity[0.5`, RGBColor[0.93, 0.27, 0.27]]}, {0.4`, Opacity[0.5`, RGBColor[0.93, 0.27, 0.27]]}, {0.6`, Opacity[0.5`, RGBColor[0.93, 0.27, 0.27]]}, {0.8`, Opacity[0.5`, RGBColor[0.93, 0.27, 0.27]]}, {1.`, Opacity[0.5`, RGBColor[0.93, 0.27, 0.27]]}}
}]](https://www.wolframcloud.com/obj/resourcesystem/images/c74/c744c80f-9107-492f-a8b6-74eb88b0c3f1/5c80734f44743d17.png) |
| Out[6]= |  |
Use a grayscale theme:
| In[7]:= |
| Out[7]= | 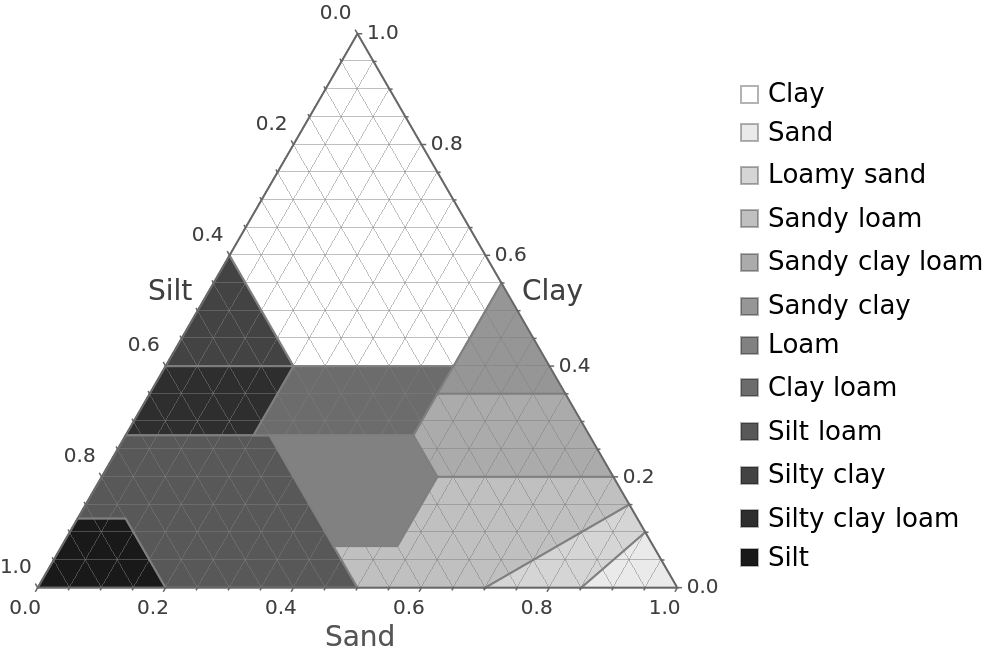 |
Recolor the region corresponding to a soil type on the plot:
| In[8]:= |
| Out[8]= | 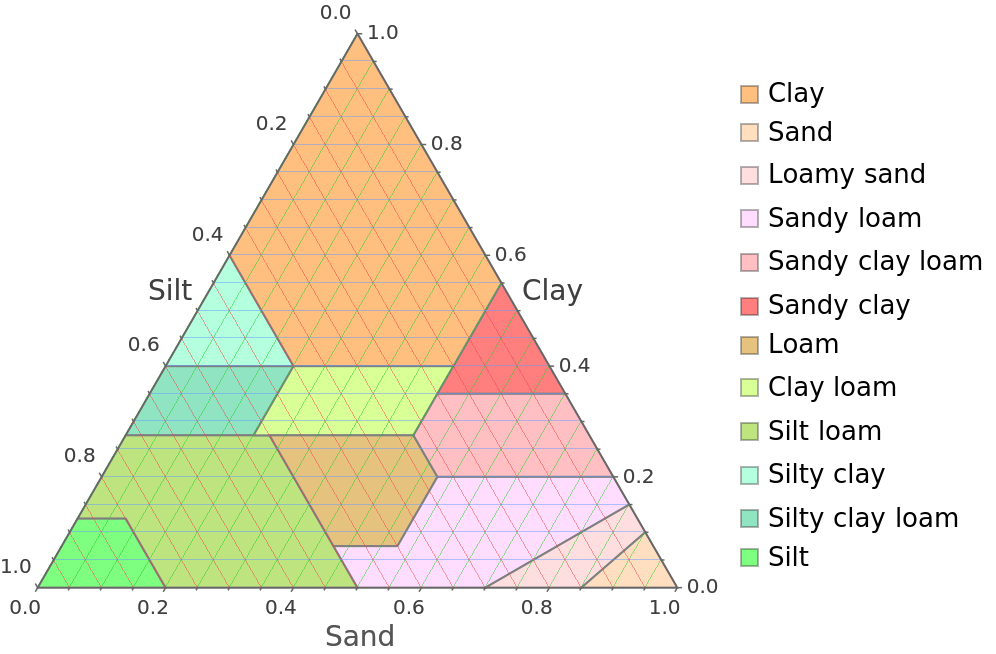 |
Recolor all soil type regions:
| In[9]:= | ![ResourceFunction["SoilTexturePlot"][
"SoilTypeColors" -> <|"Silt" -> RGBColor[
0.2823529411764706, 0.22745098039215686`, 0.2235294117647059], "Silty clay loam" -> RGBColor[
0.5647058823529412, 0.23137254901960785`, 0.15294117647058825`], "Silty clay" -> RGBColor[
0.6392156862745098, 0.39215686274509803`, 0.3333333333333333], "Silt loam" -> RGBColor[
0.8627450980392157, 0.6196078431372549, 0.2627450980392157], "Clay loam" -> RGBColor[
0.9647058823529412, 0.788235294117647, 0.5254901960784314], "Loam" -> RGBColor[
0.4588235294117647, 0.592156862745098, 0.4627450980392157], "Sandy clay" -> RGBColor[
0.23921568627450981`, 0.45098039215686275`, 0.24705882352941178`],
"Sandy clay loam" -> RGBColor[
0.34509803921568627`, 0.5803921568627451, 0.6901960784313725], "Sandy loam" -> RGBColor[
0.1843137254901961, 0.39215686274509803`, 0.49019607843137253`], "Loamy sand" -> RGBColor[
0.5686274509803921, 0.7490196078431373, 0.8431372549019608], "Sand" -> RGBColor[
0.2823529411764706, 0.22745098039215686`, 0.2235294117647059], "Clay" -> RGBColor[
0.5647058823529412, 0.23137254901960785`, 0.15294117647058825`]|>]](https://www.wolframcloud.com/obj/resourcesystem/images/c74/c744c80f-9107-492f-a8b6-74eb88b0c3f1/4a04bb68d0b90624.png) |
| Out[9]= | 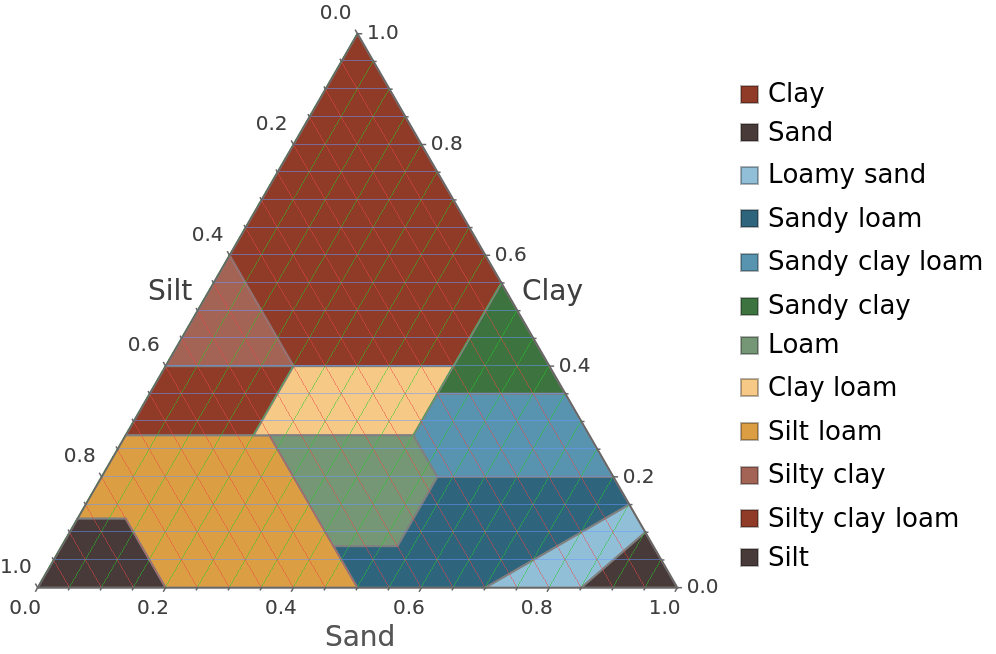 |
Recolor soil type regions using a function:
| In[10]:= | ![ResourceFunction["SoilTexturePlot"]["SoilTypeColors" -> With[
{soilTypes = {"Silt", "Silty clay loam", "Silty clay", "Silt loam",
"Clay loam", "Loam", "Sandy clay", "Sandy clay loam", "Sandy loam", "Loamy sand", "Sand", "Clay"}},
AssociationMap[
Which[
MatchQ[#, Alternatives @@ Select[soilTypes, StringContainsQ[#, "Silt"] &]],
Lighter[StandardOrange, .5],
MatchQ[#, Alternatives @@ Select[soilTypes, StringContainsQ[#, "Sand"] &]],
Lighter[StandardYellow, .5],
MatchQ[#, Alternatives @@ Select[soilTypes, StringContainsQ[#, "Clay"] &]],
Lighter[Brown, .5],
True, Darker[StandardBrown]] &,
soilTypes]]]](https://www.wolframcloud.com/obj/resourcesystem/images/c74/c744c80f-9107-492f-a8b6-74eb88b0c3f1/53d2e2e3b764a039.png) |
| Out[10]= | 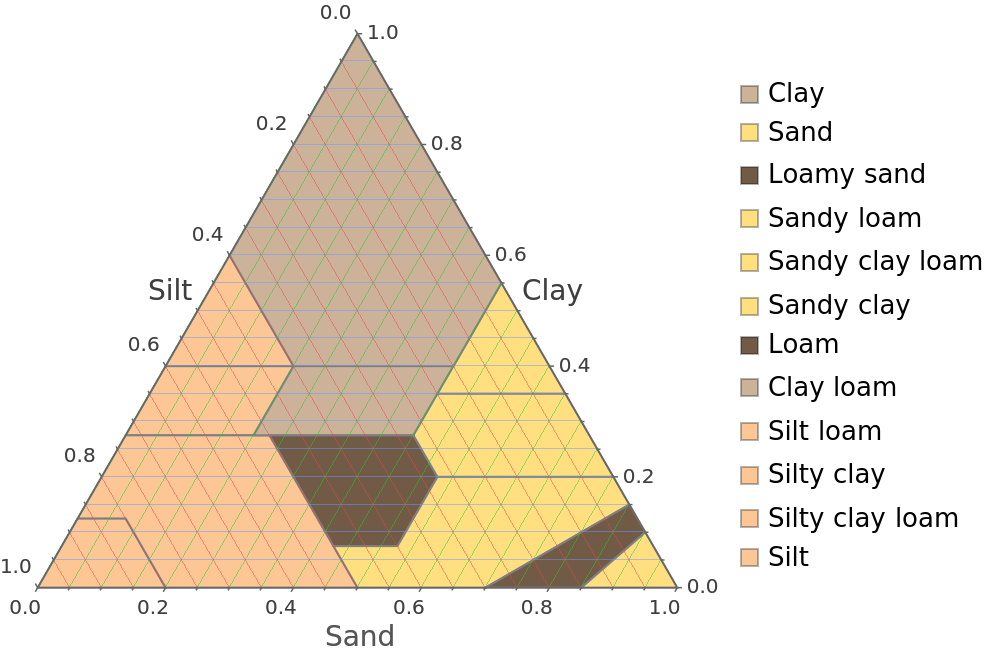 |
Visualize the classification of soil sand, clay, and silt composition samples:
| In[11]:= |
| In[12]:= |
| Out[12]= | 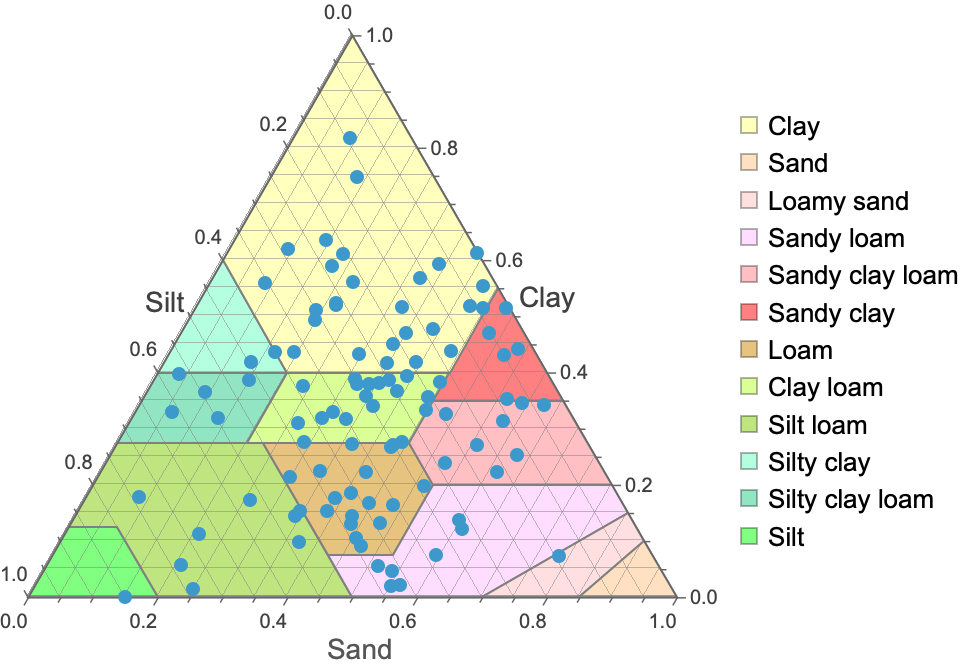 |
Study samples from parametric distributions:
| In[13]:= | ![sample = With[{
nSamples = 100,
sandDist = NormalDistribution[1, .25],
clayDist = NormalDistribution[2, .5],
siltDist = NormalDistribution[3.5, 1]
},
Thread[{
RandomVariate[sandDist, nSamples],
RandomVariate[clayDist, nSamples],
RandomVariate[siltDist, nSamples]
}]
];](https://www.wolframcloud.com/obj/resourcesystem/images/c74/c744c80f-9107-492f-a8b6-74eb88b0c3f1/7f8fc7d03bb96574.png) |
| In[14]:= |
| Out[14]= | 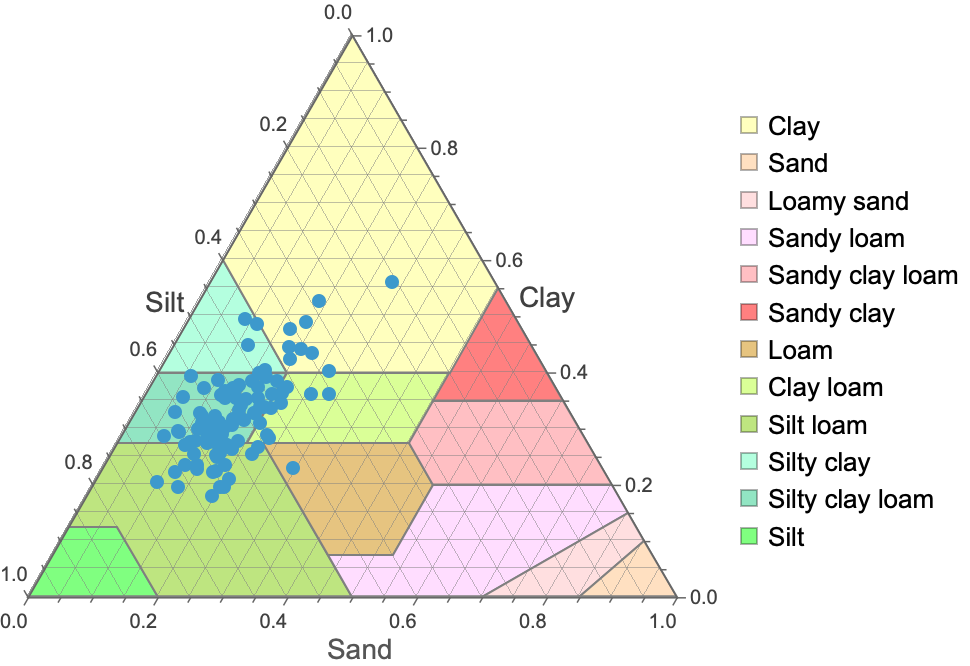 |
Negative samples can invalidate results:
| In[15]:= |
| Out[15]= |  |
This work is licensed under a Creative Commons Attribution 4.0 International License