Wolfram Function Repository
Instant-use add-on functions for the Wolfram Language
Function Repository Resource:
Visualization of the evolution of a sequential substitution system
ResourceFunction["SequentialSubstitutionSystemPlot"][history] plots the evolution history of a sequential substitution system. |
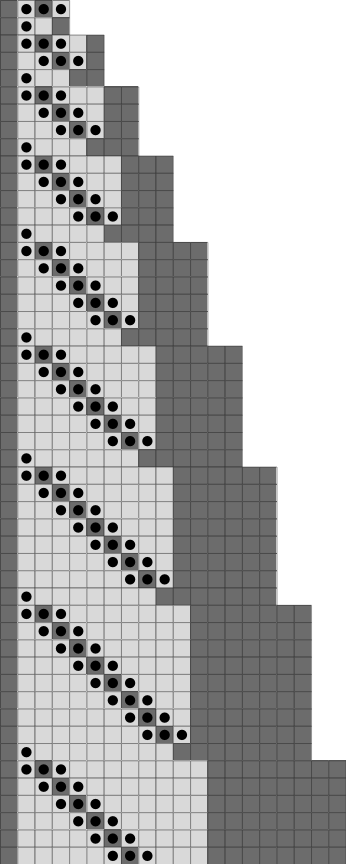
Plot the evolution of a sequential substitution system:
| In[1]:= |
![ResourceFunction["SequentialSubstitutionSystemPlot"][
ResourceFunction[
"SequentialSubstitutionSystem"][{{0, 1, 0} -> {0, 0, 1}, {0} -> {0,
1, 0}}, {1, 0, 1, 0}, 50]]](https://www.wolframcloud.com/obj/resourcesystem/images/c6a/c6a572f9-72c2-460c-a4ea-5b4f56213d45/5a13b19f0bb27f4d.png)
|
| Out[1]= |
|
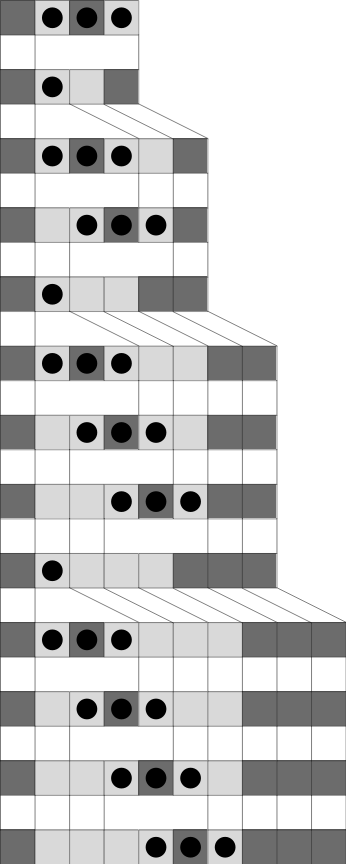
Use the option "Spaced" to track where the sequence is matched:
| In[2]:= |
![ResourceFunction["SequentialSubstitutionSystemPlot"][
ResourceFunction[
"SequentialSubstitutionSystem"][{{0, 1, 0} -> {0, 0, 1}, {0} -> {0,
1, 0}}, {1, 0, 1, 0}, 13], "Spaced" -> True]](https://www.wolframcloud.com/obj/resourcesystem/images/c6a/c6a572f9-72c2-460c-a4ea-5b4f56213d45/003a94c47f8db88d.png)
|
| Out[2]= |
|
Show no spacing between rows:
| In[3]:= |
![ResourceFunction["SequentialSubstitutionSystemPlot"][
ResourceFunction[
"SequentialSubstitutionSystem"][{{1, 0, 1} -> {0, 1, 0}, {0} -> {1}, {1} -> {1, 0, 0}}, {1, 0, 1, 0}, 100], "Spaced" -> False]](https://www.wolframcloud.com/obj/resourcesystem/images/c6a/c6a572f9-72c2-460c-a4ea-5b4f56213d45/40cb2a299316d132.png)
|
| Out[3]= |
|
Wolfram Language 11.3 (March 2018) or above
This work is licensed under a Creative Commons Attribution 4.0 International License