Wolfram Function Repository
Instant-use add-on functions for the Wolfram Language
Function Repository Resource:
Plot an array of values, with dots at specified positions
ResourceFunction["DottedArrayPlot"][{{a1, a2,…},{i1, i2,…}}] plots the values an, with dots at position in. | |
ResourceFunction["DottedArrayPlot"][{{{a11, a12,…},{a21,…},…},{{i11, i21,…},{i21,…},…}}] plots the values anm, with dots at position inm. |
| ColorFunction | Automatic | how each cell should be colored |
| ColorFunctionScaling | True | whether to scale the argument to ColorFunction |
| Mesh | True | whether to draw a mesh |
| MeshStyle | Automatic | the style to use for a mesh |
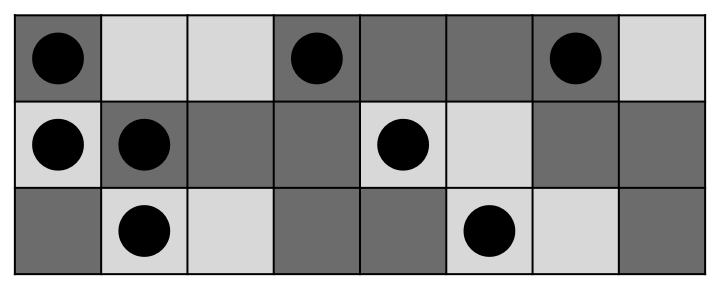
Plot a sequence of bits with various positions indicated:
| In[1]:= |
|
| Out[1]= |

|
Wolfram Language 11.3 (March 2018) or above
This work is licensed under a Creative Commons Attribution 4.0 International License