Wolfram Function Repository
Instant-use add-on functions for the Wolfram Language
Function Repository Resource:
Give the distance between two points in hyperbolic space
ResourceFunction["HyperbolicDistance"][u,v,"metric"] gives the distance between vectors u and v in hyperbolic space, using the specified metric. |
| "Beltrami" | Beltrami–Klein disk metric |
| "HalfPlane" | Poincaré half-plane metric |
| "Poincare" | Poincaré disk metric |
Distance between two vectors on the Poincaré disk:
| In[1]:= |
|
| Out[1]= |
|
Distance between numeric vectors on the Poincaré disk:
| In[2]:= |
|
| Out[2]= |
|
Distance between two points on the Beltrami–Klein ball:
| In[3]:= |
|
| Out[3]= |
|
Distance between two points in the Poincaré half-plane model:
| In[4]:= |
|
| Out[4]= |
|
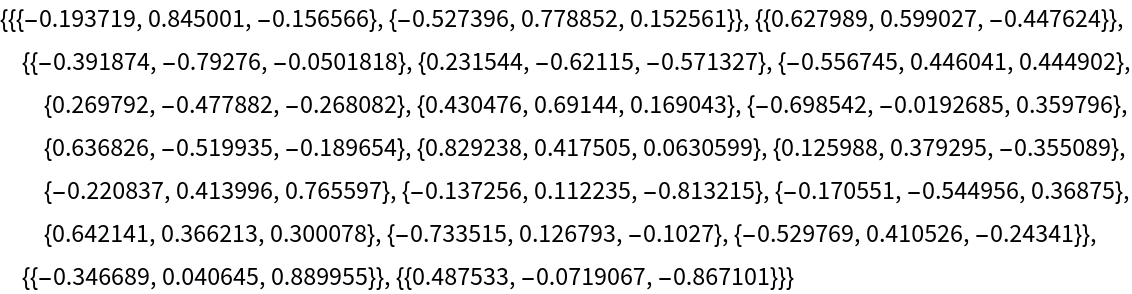
Cluster data on the Poincaré ball:
| In[5]:= |
![FindClusters[RandomPoint[Ball[], 20], DistanceFunction -> (ResourceFunction["HyperbolicDistance"][#1, #2, "Poincare"] &)]](https://www.wolframcloud.com/obj/resourcesystem/images/c45/c457709c-221f-44ca-b858-c93a0a0d88d0/2e88e271e5090635.png)
|
| Out[5]= |
|
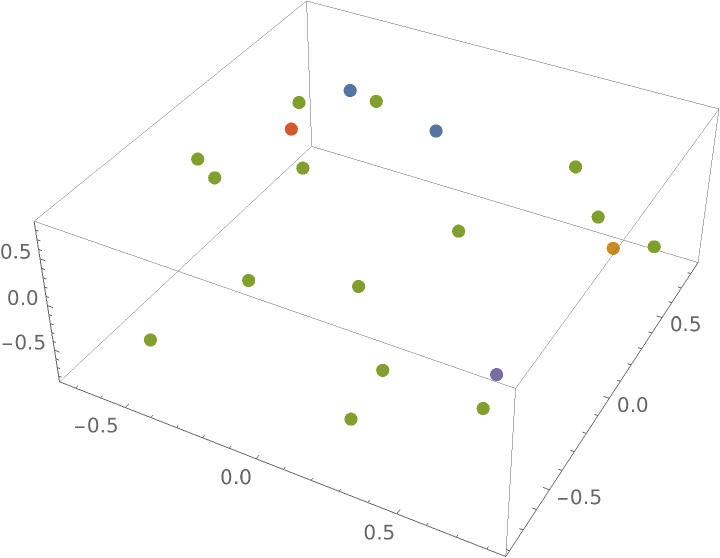
Visualize the clusters:
| In[6]:= |
|
| Out[6]= |
|
If at least one of the points supplied is a point at infinity, HyperbolicDistance returns Infinity:
| In[7]:= |
|
| Out[7]= |
|
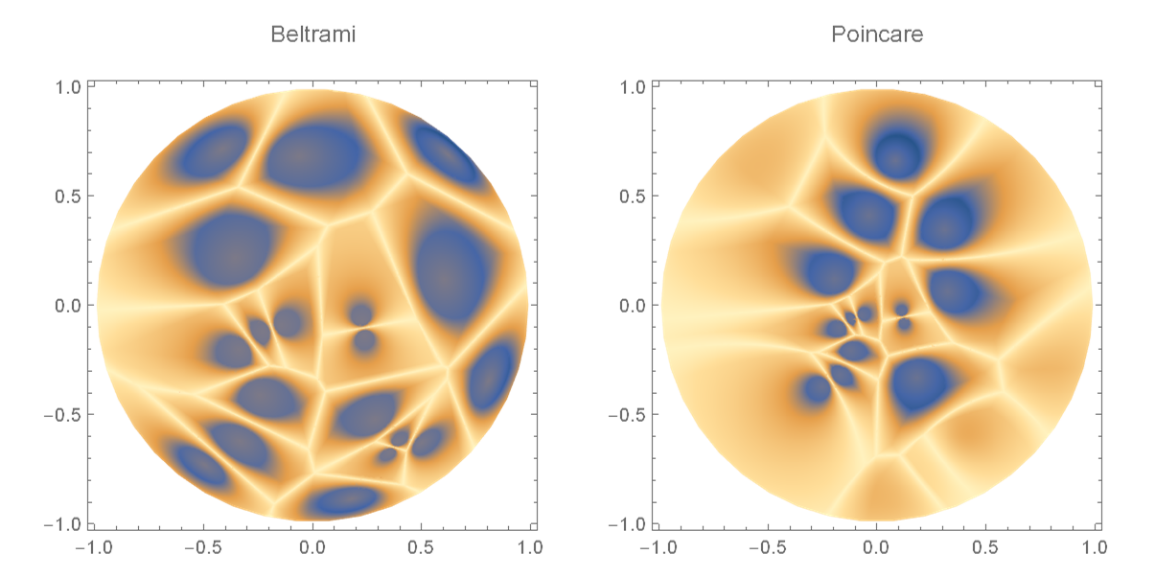
Visualize the Voronoi diagram of points on the Beltrami-Klein and Poincaré models:
| In[8]:= |
![bPts = RandomPoint[Disk[], 20];
pPts = #/(1 + Sqrt[1 - (SquaredEuclideanDistance @@ #)]) & /@ bPts;
bNF = Nearest[bPts -> "Distance", DistanceFunction -> (ResourceFunction["HyperbolicDistance"][#1, #2, "Beltrami"] &)]; pNF = Nearest[pPts -> "Distance", DistanceFunction -> (ResourceFunction["HyperbolicDistance"][#1, #2, "Poincare"] &)];](https://www.wolframcloud.com/obj/resourcesystem/images/c45/c457709c-221f-44ca-b858-c93a0a0d88d0/0b0c552a4a1cd86e.png)
|
| In[9]:= |
![GraphicsRow[{DensityPlot[
Module[{res = bNF[{x, y}, 2], tmp}, tmp = 1 - ResourceFunction["RationalSmoothStep"][
Clip[Rescale[res[[1]], {-6, 6}], {0, 1}]]; Max[tmp, res[[1]]/res[[2]]]], {x, y} \[Element] Disk[{0, 0}, 0.99], PlotLabel -> "Beltrami", PlotPoints -> 150, PlotRange -> All],
DensityPlot[
Module[{res = pNF[{x, y}, 2], tmp}, tmp = 1 - ResourceFunction["RationalSmoothStep"][
Clip[Rescale[res[[1]], {-6, 6}], {0, 1}]]; Max[tmp, res[[1]]/res[[2]]]], {x, y} \[Element] Disk[{0, 0}, 0.99], PlotLabel -> "Poincare", PlotPoints -> 150, PlotRange -> All]}]](https://www.wolframcloud.com/obj/resourcesystem/images/c45/c457709c-221f-44ca-b858-c93a0a0d88d0/2fb16492ef77656a.png)
|
| Out[9]= |
|
This work is licensed under a Creative Commons Attribution 4.0 International License