Wolfram Function Repository
Instant-use add-on functions for the Wolfram Language
Function Repository Resource:
Compute the z-statistic for the Mann-Kendall test
ResourceFunction["MannKendallZ"][data] computes the z-statistic for the Mann–Kendall test. |
Compute the z-statistic for a list of data points:
| In[1]:= |
| Out[1]= |
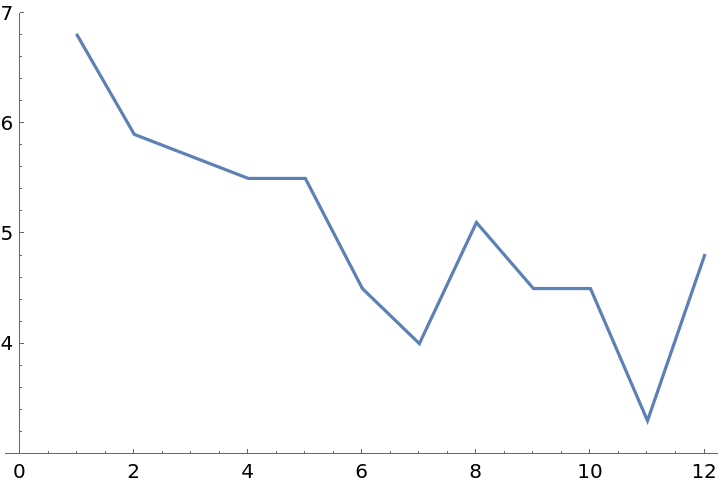
The statistic is negative, indicating a downward trend:
| In[2]:= |
| Out[2]= |  |
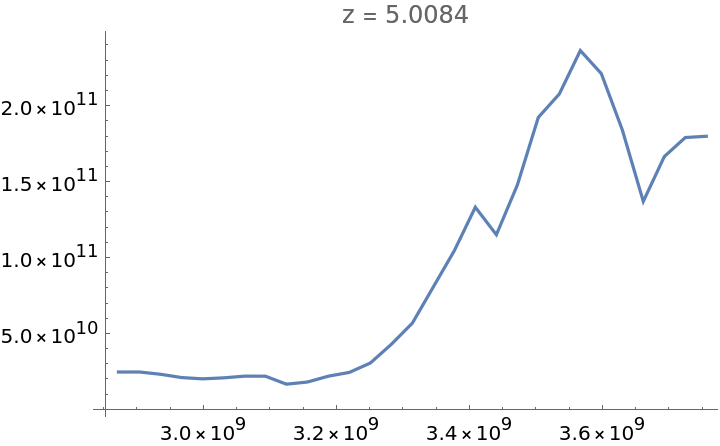
Various sets of data demonstrating negative, zero and positive trends, along with their corresponding z-statistics:
| In[3]:= | ![ListLinePlot[#, PlotLabel -> Row[{"z = ", N @ ResourceFunction["MannKendallZ"][#]}]] & /@ {{4, 9, 1, -3, 2, -2}, {0, -2, 1, 0.5, -0.8}, {1, 7, 2, 9, 4, 12}}](https://www.wolframcloud.com/obj/resourcesystem/images/c39/c390f35b-e86e-49d7-927c-72d70977e05a/5ee16d1002b8e85e.png) |
| Out[3]= |  |
Compute the z-statistic of a TimeSeries object:
| In[4]:= |
| Out[4]= |
Use MannKendallZ to determine the general trend of the GDP of Kazakhstan from 1991 to 2019:
| In[5]:= |
| Out[5]= |
| In[6]:= |
| Out[6]= |
The plot confirms the generally positive trend of the data:
| In[7]:= |
| Out[7]= |  |
Compute the corresponding p-value for a two-sided test:
| In[8]:= |
| Out[8]= |
This work is licensed under a Creative Commons Attribution 4.0 International License