Wolfram Function Repository
Instant-use add-on functions for the Wolfram Language
Function Repository Resource:
Trend line of a given set of data
ResourceFunction["TrendLine"][{{x1,y1},{x2,y2},…}] returns an InfiniteLine representing the least-squares line fit of the points {xi,yi}. |
Here is some data:
| In[1]:= |
The trend line for the data:
| In[2]:= |
| Out[2]= |
Show the data and the trend line together:
| In[3]:= |
| Out[3]= | 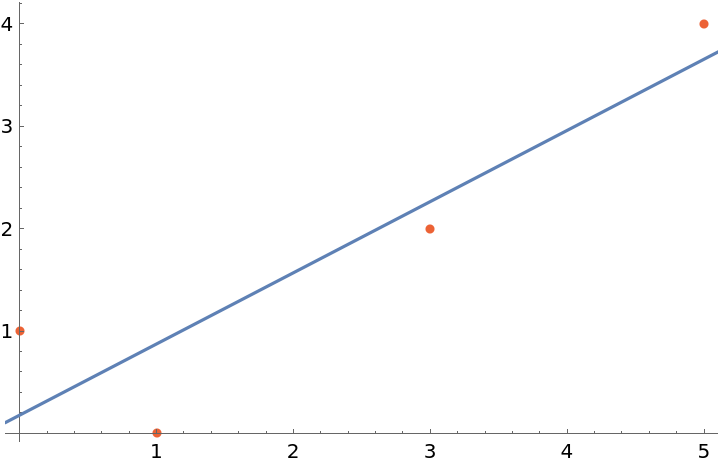 |
Here is some data:
| In[4]:= |
The linear function corresponding to the result of TrendLine is equivalent to the results returned by functions such as Fit and LinearModelFit:
| In[5]:= |
| Out[5]= |
| In[6]:= |
| Out[6]= |
| In[7]:= |
| Out[7]= |
Show the lines together:
| In[8]:= |
| Out[8]= | 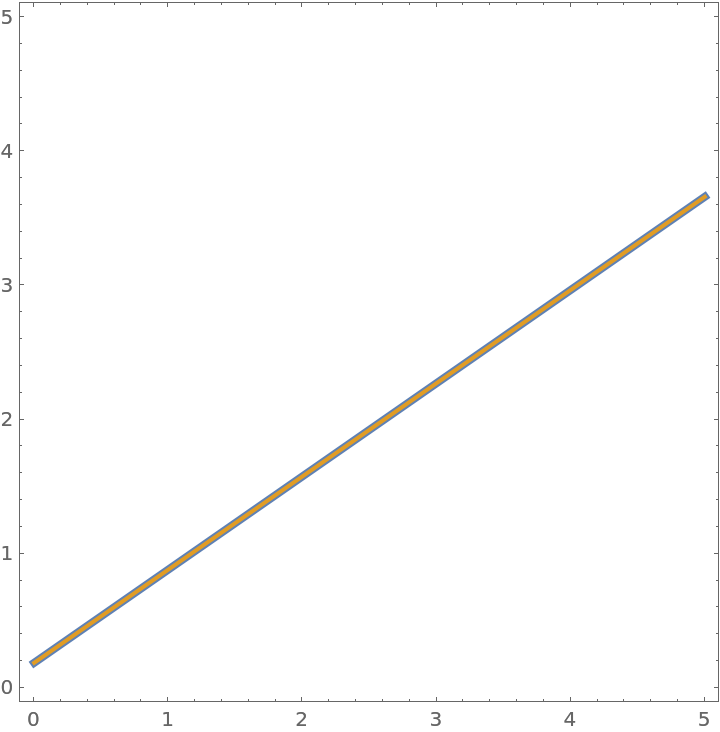 |
This work is licensed under a Creative Commons Attribution 4.0 International License