Details and Options
Intrinsically Disordered Regions (IDRs) of proteins are the regions that lack a fixed or ordered three-dimensional structure.
The function works on computationally predicted protein structures and computes the IDRs based on the averaged confidence of prediction.
The confidence values range from 0 to 100 with higher values indicating better prediction accuracy.
Whether a given residue (amino acid for proteins) belongs to a disordered region is determined by the
Mean of the prediction confidence for 20 residues to the left and right of the residue, along with the residue itself. This averaging length and function can be changed using the "AveragingLength" and "AveragingFunction"
Options respectively.
Residues with average confidence of prediction >80, < 70 and between 70 and 80 are initially labelled as folded, disordered and gap regions, respectively. Next, folded and disordered regions shorter than 10 residues are reclassified as gaps.
The initial confidence cutoff for determining the disordered or folded regions can be changed using the "ConfidenceCutoff" Option.
Finally, gap regions are redefined as disordered if (i) they have disordered regions on both sides or (ii) are terminal and preceded or followed by a disordered region.
The default minimum length of a disordered or folded region is 10. This can be changed using the "MinIDRLength" option.
BioSequence must be a continuous peptide sequence of 400 amino acids or fewer.
IDRs of a
BioSequence corresponds to the disorder in the predicted protein structure with the same sequence.
Proteins should be predicted structures when using filename or
BioMolecule.
The output is an
Association containing the disordered regions of a biomolecule with
Keys as the chain labels.
BioMoleculeIDRs has the following options:
| "ConfidenceCutoff" | <|"Disordered"→70.,"Folded"→80.|> | confidence cutoff below(above) which regions are initially
marked as disordered(folded) |
| "MinIDRLength" | 10 | minimum length of a disordered region |
| "AveragingLength" | 20 | number of residues before and after the target residue for computing the average confidence of prediction |
| "AveragingFunction" | Mean | averaging function for confidence scores |
| "FoldedRegions" | False | when True data for the folded regions are included |
BioMoleculeIDRs is based on Tesei, G., Trolle, A.I., Jonsson, N. et al. Conformational ensembles of the human intrinsically disordered proteome. Nature 626, 897–904 (2024).
https://doi.org/10.1038/s41586-023-07004-5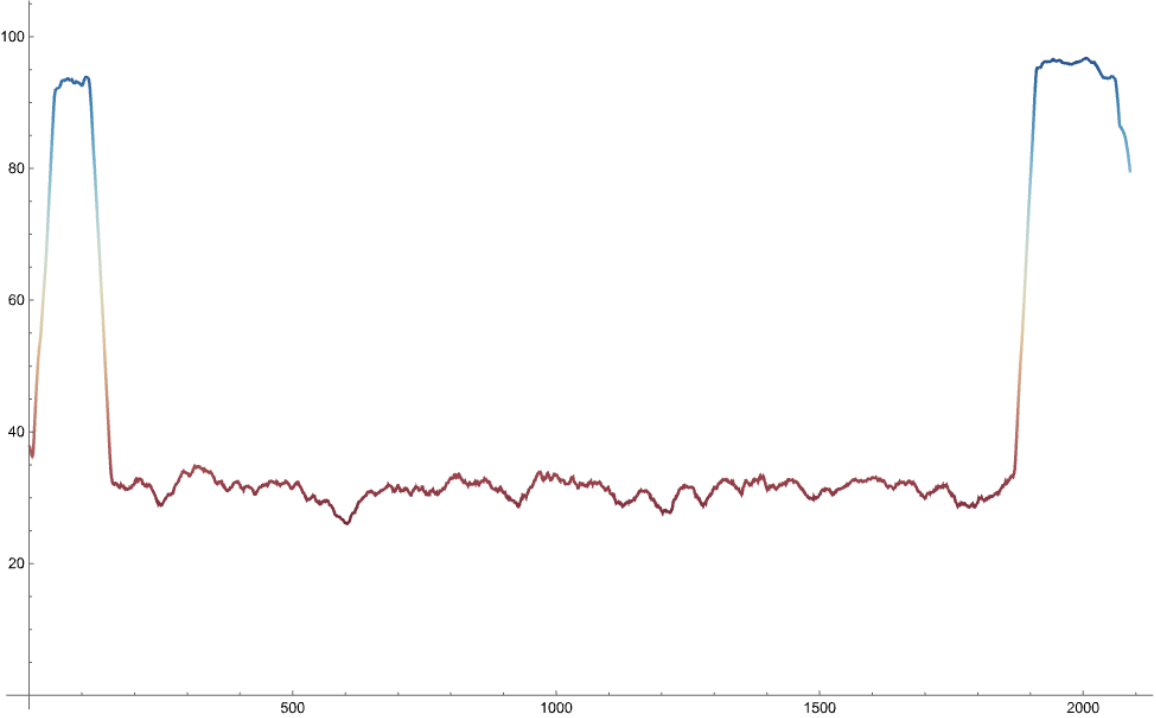

![ResourceFunction["BioMoleculeIDRs"][
BioSequence[
"Peptide", "MDIAVLPNNNHPEKFLQLDVGMLPATHGMFQIGAVLSGQRQWQNKMYLQGREKEMEGKLSADSDVFEDRELEKHITPQTLKPKIKQNPLFSHINITDIEENKSKPSWTIQDYDRHTAHGQLADYMKDPKELSFWLEDLYTPGYDSLLKKKAAEIKRNKICKMLAAIILLVCVVVIIITVPILVTQSRD", {}]]](https://www.wolframcloud.com/obj/resourcesystem/images/ba6/ba6aecd5-1023-4f08-9e2d-553ddcea4aea/4c7d0ab7df400add.png)
![(* Evaluate this cell to get the example input *) CloudGet["https://www.wolframcloud.com/obj/1f3846f7-651b-4d63-9751-641196fb1690"]](https://www.wolframcloud.com/obj/resourcesystem/images/ba6/ba6aecd5-1023-4f08-9e2d-553ddcea4aea/74b4425054d121e1.png)
![ResourceFunction["BioMoleculeIDRs"][
ExternalIdentifier["UniProtKBAccessionNumber", "P06748"], "ConfidenceCutoff" -> <|"Disordered" -> 60, "Folded" -> 70|>]](https://www.wolframcloud.com/obj/resourcesystem/images/ba6/ba6aecd5-1023-4f08-9e2d-553ddcea4aea/52b627c547930314.png)
![ResourceFunction["BioMoleculeIDRs"][
ExternalIdentifier["UniProtKBAccessionNumber", "P06748"], "ConfidenceCutoff" -> <|"Disordered" -> 50, "Folded" -> 80|>]](https://www.wolframcloud.com/obj/resourcesystem/images/ba6/ba6aecd5-1023-4f08-9e2d-553ddcea4aea/2e77a49ee091d9ba.png)

![AssociationThread[idrIDs, ResourceFunction["BioMoleculeIDRs"][
ExternalIdentifier["UniProtKBAccessionNumber", #]] & /@ idrIDs]](https://www.wolframcloud.com/obj/resourcesystem/images/ba6/ba6aecd5-1023-4f08-9e2d-553ddcea4aea/49f6ebb9cbe7192b.png)

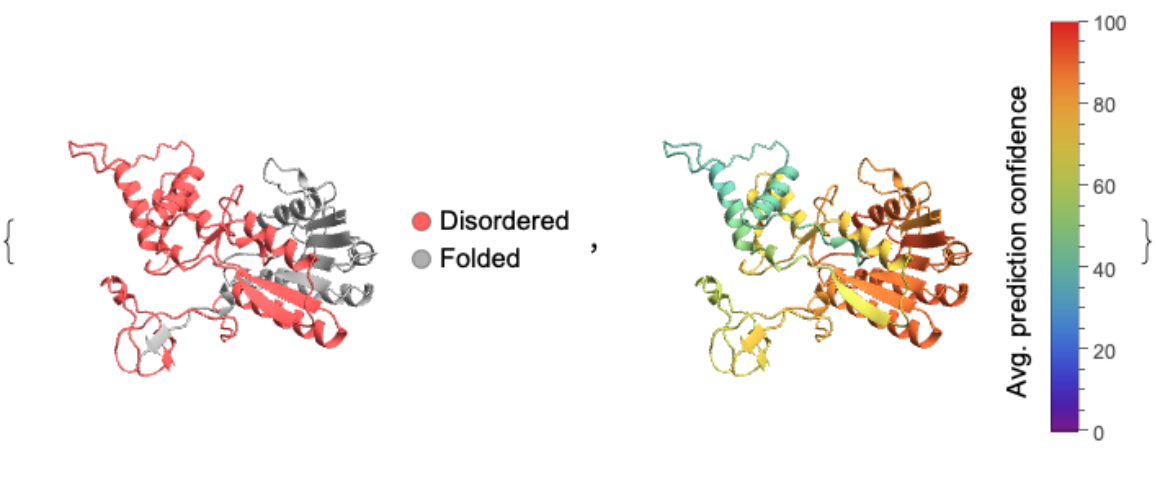
![id = "MGYP002143454457";
cf = "Rainbow";
conf = ResourceFunction["BioMoleculeIDRs"][id, "AveragePredictionConfidence"];
bm = ServiceExecute["ESMAtlas", "PredictedStructure", {"MGnifyID" -> id}];
cols = Map[ColorData[cf], (0.01*conf), {2}];
keys = Flatten[
Table[{(Keys@cols)[[i]], #} & /@ Range@Length@(Values@cols)[[i]], {i, Length@cols}], 1];
colRules = Thread[keys -> Flatten@Values@cols];
idr = ResourceFunction["BioMoleculeIDRs"][id];
validIDRs = DeleteCases[idr, _ {}];
pos = If[SameQ[validIDRs, <||>], {}, MapApply[Range, idr]];
disorderColor = Lighter@Red;
foldedColor = Lighter@Gray;
colorRules = If[SameQ[pos, {}], {_ -> foldedColor}, Join[Map[(# -> disorderColor) &, Flatten[KeyValueMap[Thread[{#1, Flatten@#2}] &, pos], 1]], {_ -> foldedColor}]];
{BioMoleculePlot3D[bm, ColorRules -> colorRules, PlotLegends -> SwatchLegend[{disorderColor, foldedColor}, {"Disordered", "Folded"},
LegendMarkers -> "Bubble"]],
BioMoleculePlot3D[bm, ColorRules -> colRules, PlotLegends -> BarLegend[{cf, {0, 100}}, LegendLabel -> Placed["Avg. prediction confidence", Left, Rotate[#, 90 Degree] &]]]}](https://www.wolframcloud.com/obj/resourcesystem/images/ba6/ba6aecd5-1023-4f08-9e2d-553ddcea4aea/375edae2f2dbc7f4.png)