Wolfram Function Repository
Instant-use add-on functions for the Wolfram Language
Function Repository Resource:
Visualize the intrinsically disordered regions (IDRs) in a protein
ResourceFunction["BioMoleculeIDRPlot3D"][protein] shows the 3D structure of protein with the intrinsically disordered regions highlighted. | |
ResourceFunction["BioMoleculeIDRPlot3D"][protein,"AveragePredictionConfidence"] shows protein with coloring based on the averaged confidence of disorder prediction. |
| ColorRules | <|"Disordered"→Lighter@Red,"Folded"→Lighter@Blue|> | rules to color different regions of a protein |
| ColorFunction | "RedBlueTones" | color scheme when residues are colored by the averaged confidence of prediction |
Visualize the disordered and folded regions of MDC1 (Mediator of DNA damage checkpoint protein 1):
| In[1]:= |
| Out[1]= | 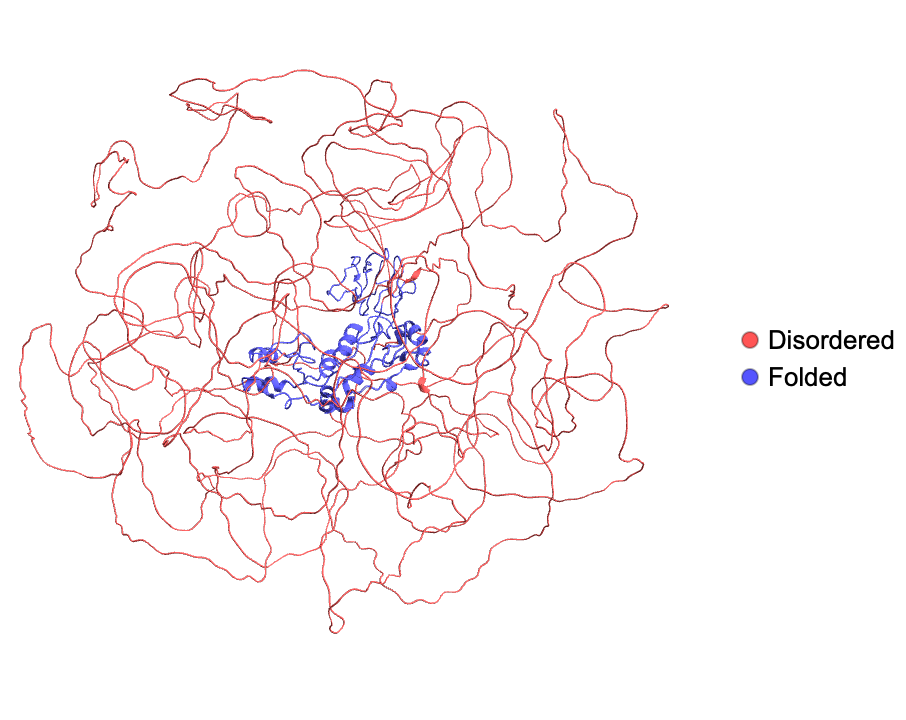 |
Visualize the average confidence of prediction for the same protein:
| In[2]:= |
| Out[2]= | 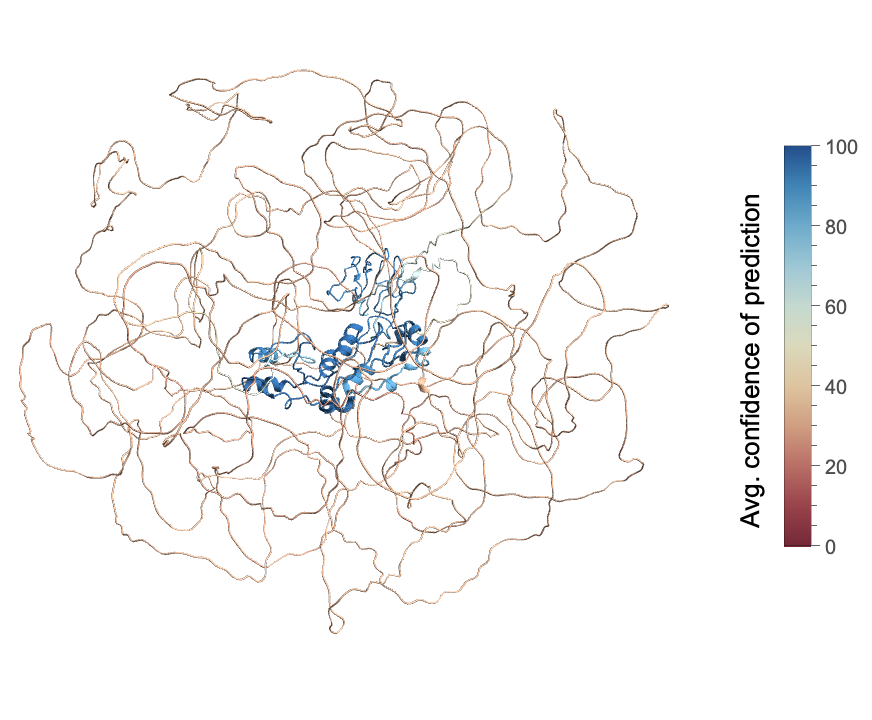 |
Visualize the disordered and folded region of a BioSequence:
| In[3]:= | ![ResourceFunction["BioMoleculeIDRPlot3D"][
BioSequence[
"Peptide", "MDIAVLPNNNHPEKFLQLDVGMLPATHGMFQIGAVLSGQRQWQNKMYLQGREKEMEGKLSADSDVFEDRELEKHITPQTLKPKIKQNPLFSHINITDIEENKSKPSWTIQDYDRHTAHGQLADYMKDPKELSFWLEDLYTPGYDSLLKKKAAEIKRNKICKMLAAIILLVCVVVIIITVPILVTQSRD", {}]]](https://www.wolframcloud.com/obj/resourcesystem/images/b18/b18f6cca-b6d1-48d7-9e6d-31da2b5f199f/5ba9de8b1d71d0a4.png) |
| Out[3]= | 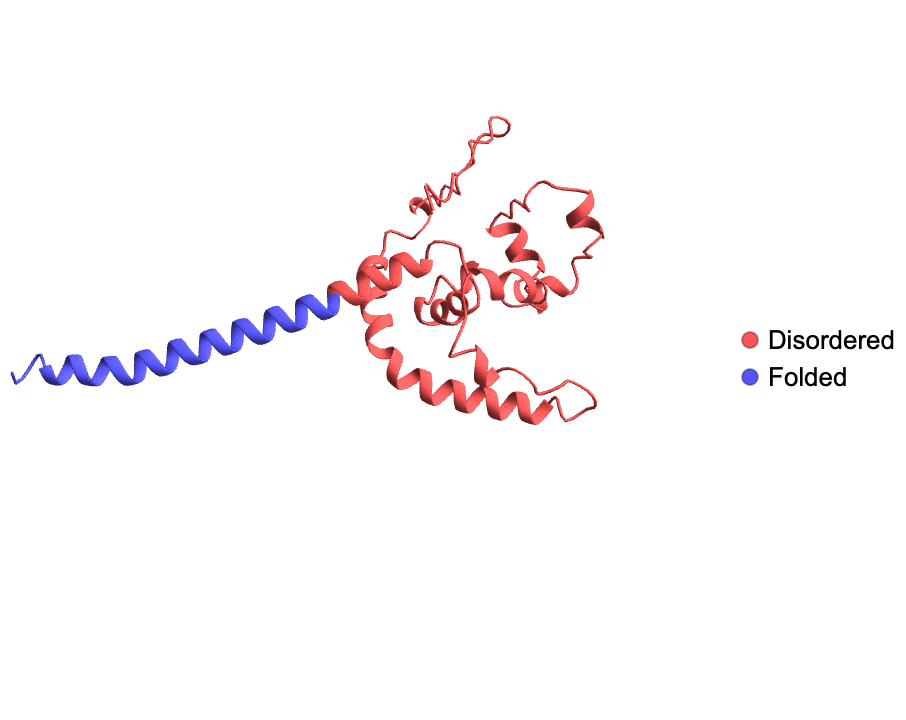 |
Also show its averaged prediction confidence:
| In[4]:= | ![ResourceFunction["BioMoleculeIDRPlot3D"][BioSequence[
"Peptide", "MDIAVLPNNNHPEKFLQLDVGMLPATHGMFQIGAVLSGQRQWQNKMYLQGREKEMEGKLSADSDVFEDRELEKHITPQTLKPKIKQNPLFSHINITDIEENKSKPSWTIQDYDRHTAHGQLADYMKDPKELSFWLEDLYTPGYDSLLKKKAAEIKRNKICKMLAAIILLVCVVVIIITVPILVTQSRD", {}], "AveragePredictionConfidence"]](https://www.wolframcloud.com/obj/resourcesystem/images/b18/b18f6cca-b6d1-48d7-9e6d-31da2b5f199f/462de73b13fff1a0.png) |
| Out[4]= | 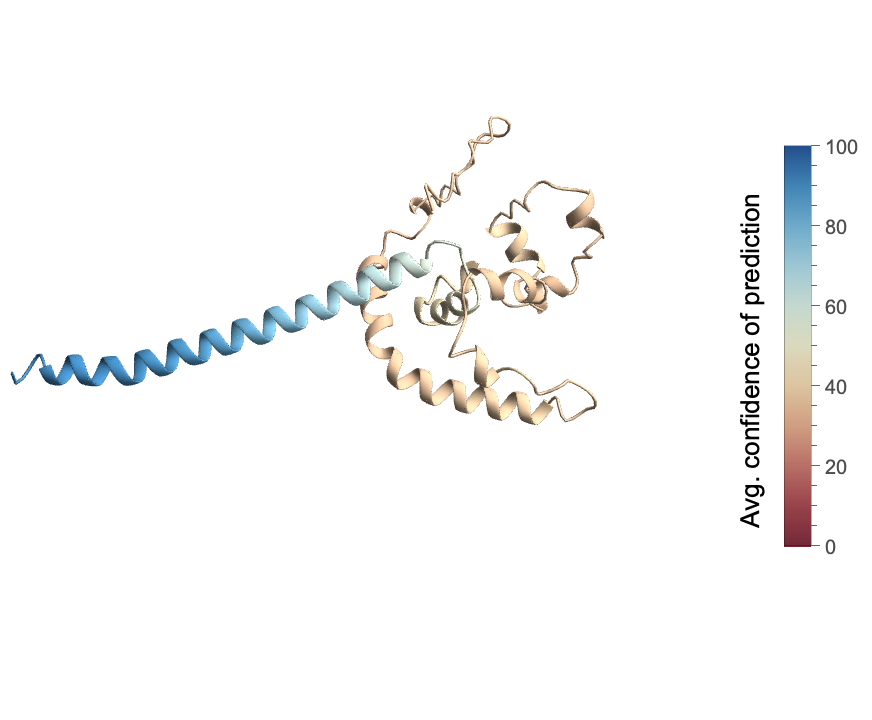 |
Visualize the disordered and folded regions of a protein from the ESM Metagenomic Atlas:
| In[5]:= |
| Out[5]= | 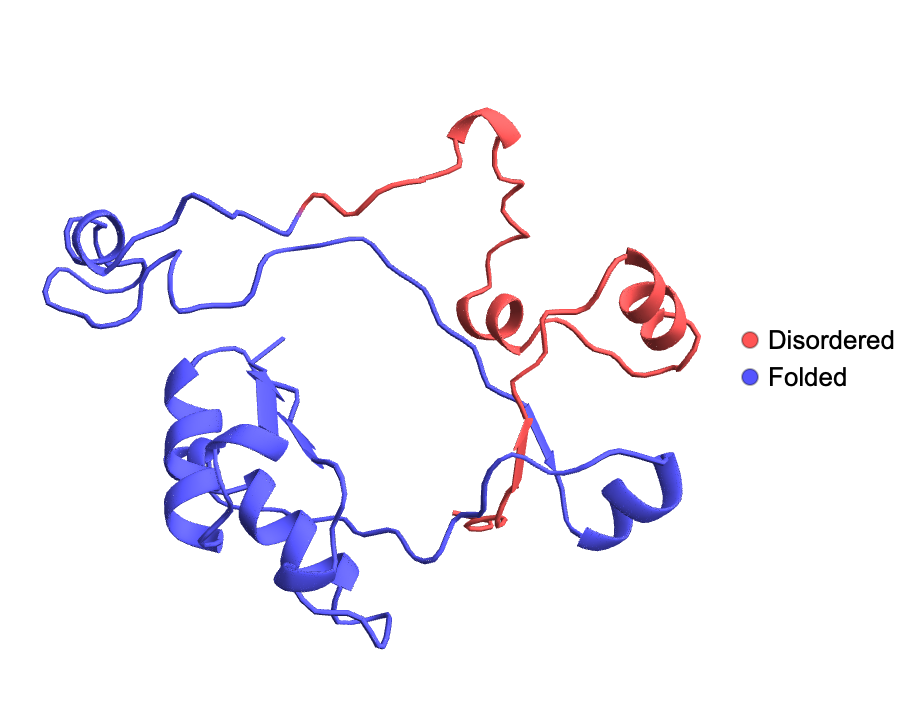 |
Visualize the structure of the disordered and folded regions of a BioMolecule:
| In[6]:= | ![(* Evaluate this cell to get the example input *) CloudGet["https://www.wolframcloud.com/obj/026d851c-e052-40a1-892b-ccb5a1d61d53"]](https://www.wolframcloud.com/obj/resourcesystem/images/b18/b18f6cca-b6d1-48d7-9e6d-31da2b5f199f/15c90b14e044f884.png) |
| In[7]:= | ![(* Evaluate this cell to get the example input *) CloudGet["https://www.wolframcloud.com/obj/b4b54c1f-7741-461e-b23a-ddc4f8c39eba"]](https://www.wolframcloud.com/obj/resourcesystem/images/b18/b18f6cca-b6d1-48d7-9e6d-31da2b5f199f/7d4fb14474044c3c.png) |
Set colors for different regions:
| In[8]:= |
| Out[8]= | 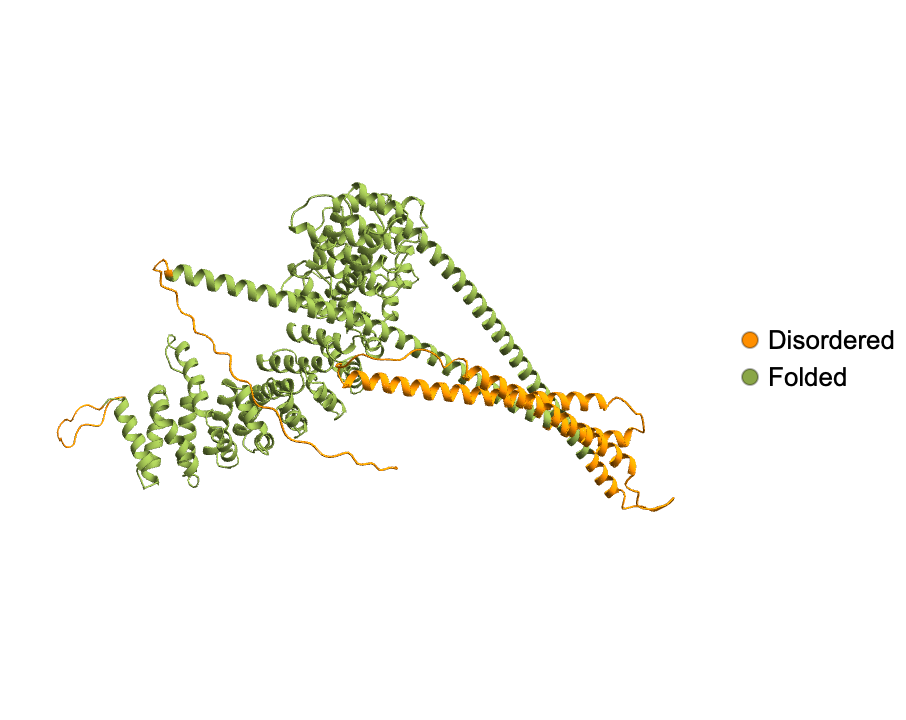 |
"ConfidenceCutoff" determines how long the disordered regions will be:
| In[10]:= | ![MapThread[
ResourceFunction["BioMoleculeIDRPlot3D"][
ExternalIdentifier["UniProtKBAccessionNumber", "P06748"], "ConfidenceCutoff" -> #, PlotLabel -> Style[#2, Black]] &, {{<|"Disordered" -> 60, "Folded" -> 70|>, <|"Disordered" -> 50, "Folded" -> 80|>}, {"Less stringent cutoff", "More stringent cutoff"}}]](https://www.wolframcloud.com/obj/resourcesystem/images/b18/b18f6cca-b6d1-48d7-9e6d-31da2b5f199f/10c041911e4127c8.png) |
| Out[10]= | 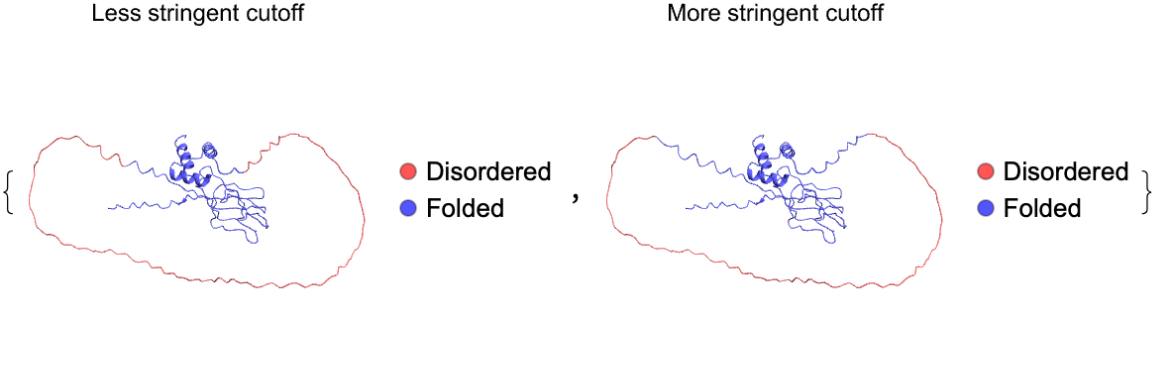 |
Minimum length for IDRs can be set by using "MinIDRLength":
| In[11]:= | ![ResourceFunction["BioMoleculeIDRPlot3D"][
ExternalIdentifier["UniProtKBAccessionNumber", "Q99457"], "MinIDRLength" -> #, PlotLabel -> "Minimum IDR Length: " <> ToString@#] & /@ {15, 30}](https://www.wolframcloud.com/obj/resourcesystem/images/b18/b18f6cca-b6d1-48d7-9e6d-31da2b5f199f/58e00b32e8284640.png) |
| Out[11]= | 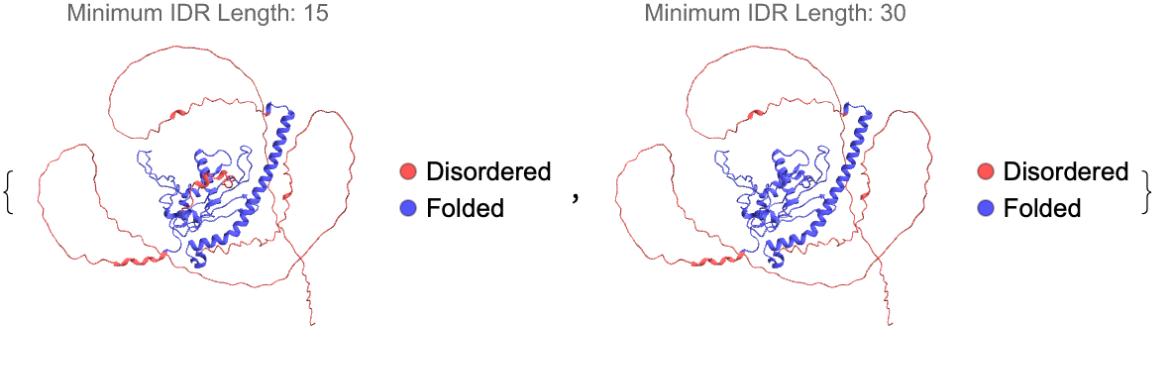 |
Here are some common UniProt IDs of human proteins with significant disorder:
| In[12]:= |
| Out[12]= |
Visualizing the disordered (red) regions for these proteins (columns 1, 3 and 5) and how it is connected to average confidence of prediction (red for lower values and blue for higher values in columns 2, 4 and 6). This code takes a while to evaluate:
| In[13]:= | ![EchoTiming@
GraphicsGrid[
Partition[
Flatten[{ResourceFunction["BioMoleculeIDRPlot3D"][
ExternalIdentifier["UniProtKBAccessionNumber", #], PlotLegends -> None], ResourceFunction["BioMoleculeIDRPlot3D"][
ExternalIdentifier["UniProtKBAccessionNumber", #], "AveragePredictionConfidence", PlotLegends -> None]} & /@ idrIDs], 6], ImageSize -> Large]](https://www.wolframcloud.com/obj/resourcesystem/images/b18/b18f6cca-b6d1-48d7-9e6d-31da2b5f199f/6025777412dc4f0b.png) |
| Out[13]= | 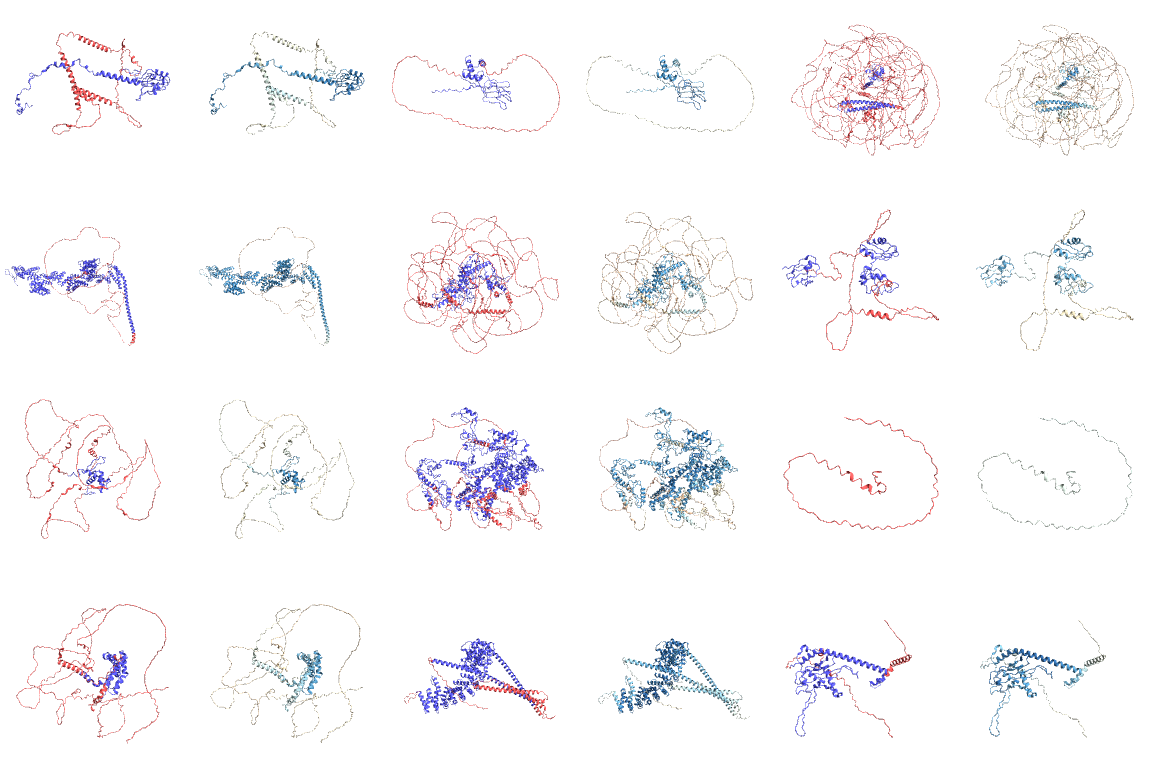 |
For invalid BioSequence inputs for which structures cannot be predicted Failure with an error message is returned:
| In[14]:= |
| Out[14]= |  |
Visualize the disordered regions in a protein in human code by FAM184A gene:
| In[15]:= |
| Out[15]= | 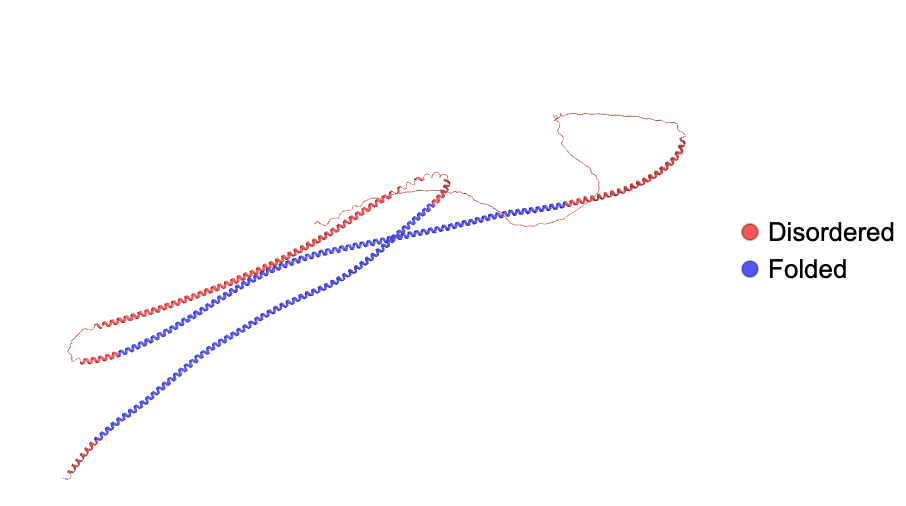 |
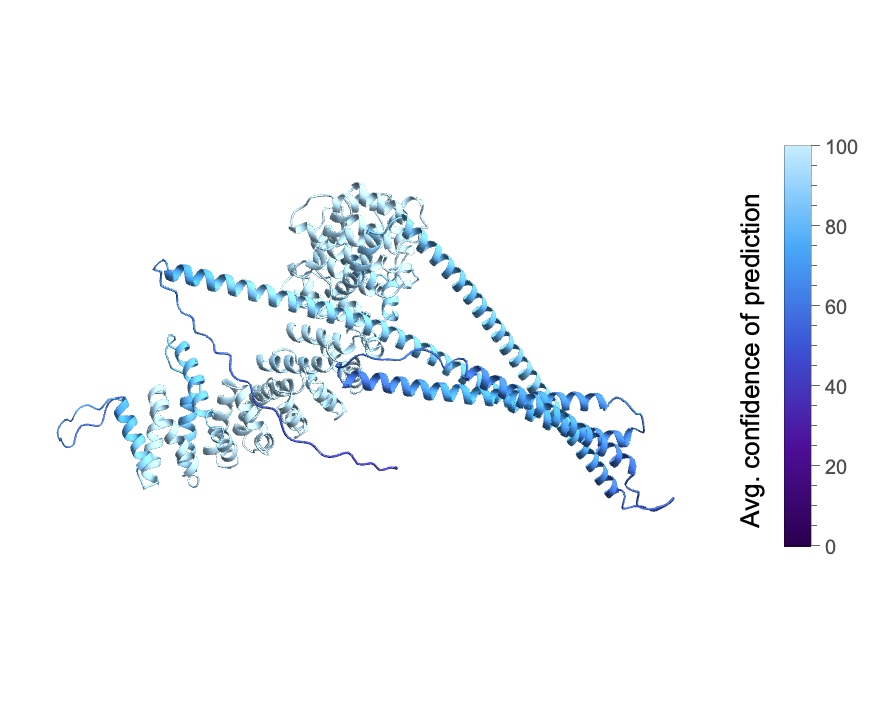
Visualize the average confidence of prediction in the protein:
| In[16]:= |
| Out[16]= | 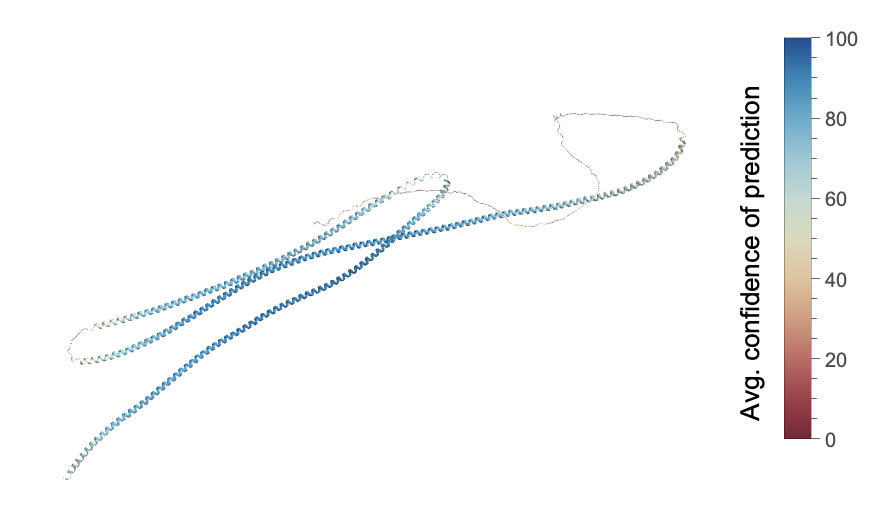 |
This work is licensed under a Creative Commons Attribution 4.0 International License
![ResourceFunction["BioMoleculeIDRPlot3D"][
ExternalIdentifier["UniProtKBAccessionNumber", "O60763"], "AveragePredictionConfidence", ColorFunction -> "DeepSeaColors"]](https://www.wolframcloud.com/obj/resourcesystem/images/b18/b18f6cca-b6d1-48d7-9e6d-31da2b5f199f/48b565ed98548c48.png)