Wolfram Function Repository
Instant-use add-on functions for the Wolfram Language
Function Repository Resource:
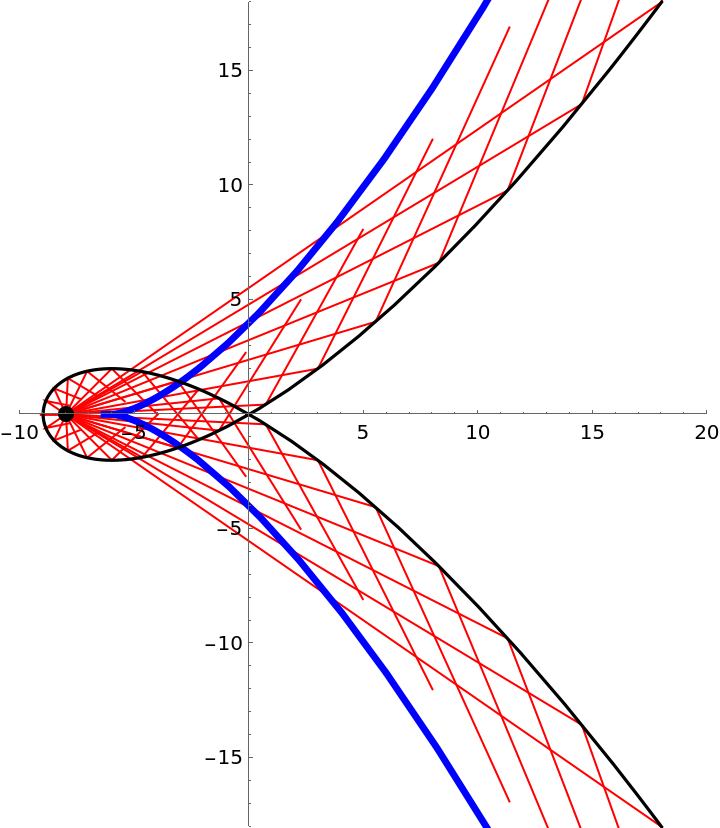
Plot the catacaustic of a curve
ResourceFunction["CatacausticCurvePlot"][c,{a,b},{t,t0,t1,dt}] plots the catacaustic of a curve c specified parametrically with respect to a point {a,b} in terms of the variable t, in the range from t0 to t1 with rays spaced in steps of dt. |
Catacaustics for a circle:
| In[2]:= | ![(* Evaluate this cell to get the example input *) CloudGet["https://www.wolframcloud.com/obj/56445331-1942-4928-8f8e-3aa7d04b6629"]](https://www.wolframcloud.com/obj/resourcesystem/images/b0d/b0dd25f6-48ed-4ade-b48a-a62f85d0a585/00b419a9c09dd326.png) |
| Out[2]= | 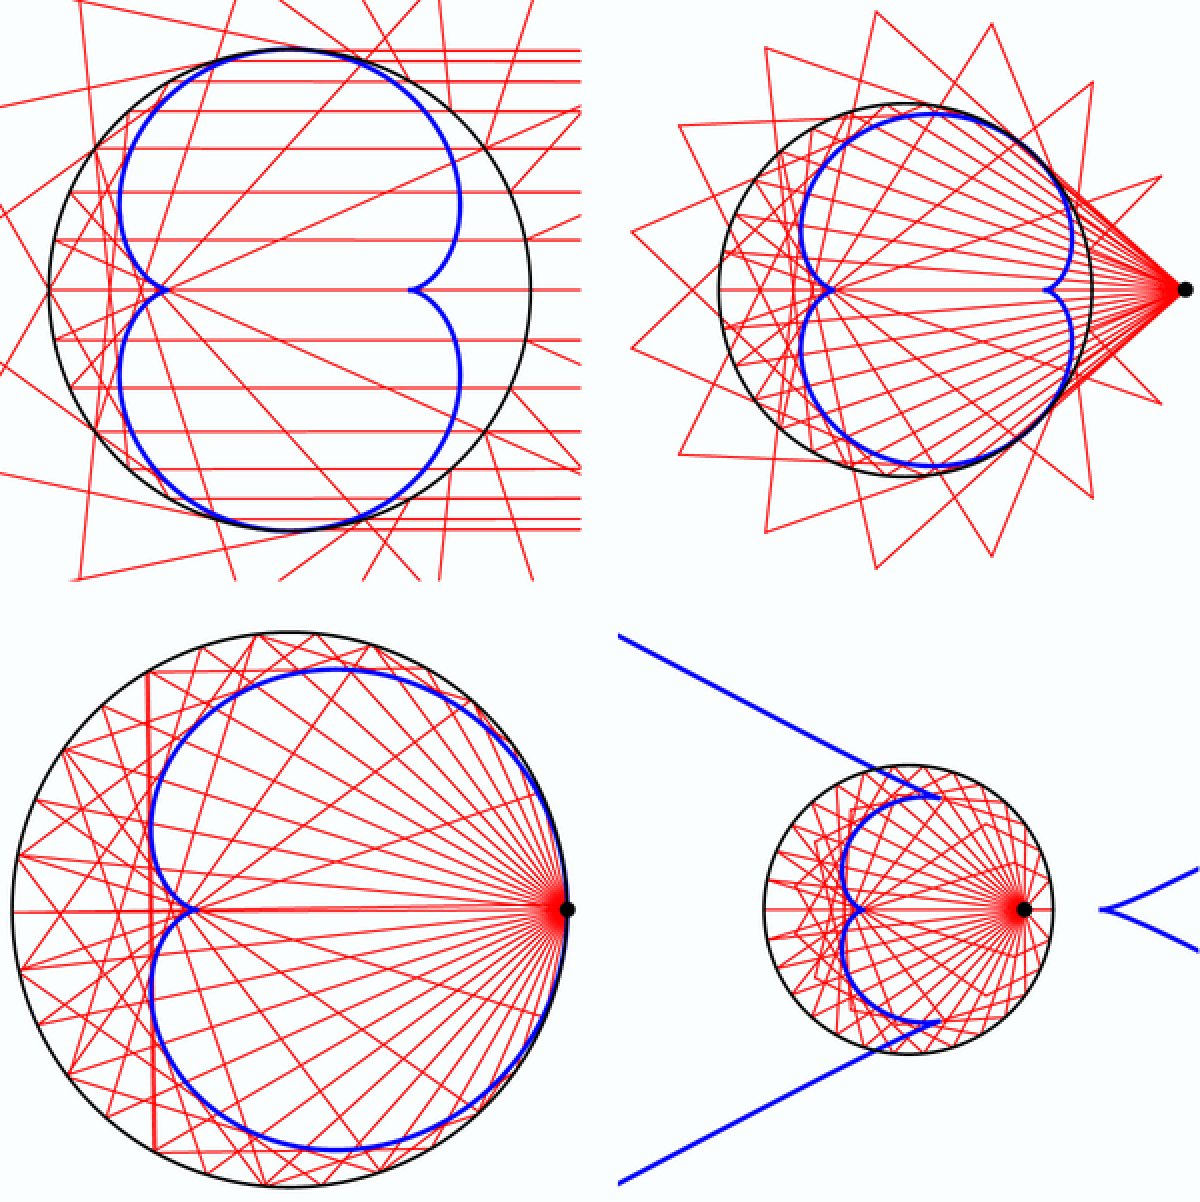 |
This work is licensed under a Creative Commons Attribution 4.0 International License