Wolfram Function Repository
Instant-use add-on functions for the Wolfram Language
Function Repository Resource:
Plot the timings of a benchmark
ResourceFunction["BenchmarkPlot"][f,g] plots the time taken to execute f with input g[n] against integer n, where the n are chosen automatically. | |
ResourceFunction["BenchmarkPlot"][f,g, {n1,n2,…}] uses the explicit ni to generate input g for f. | |
ResourceFunction["BenchmarkPlot"][{f1,f2, …},…] plots the time taken for each of the fi. | |
ResourceFunction["BenchmarkPlot"][data, …] plots the results of a previous ResourceFunction["EvaluateBenchmark"] computation. |
Get a plot for the inverse of random matrices:
| In[1]:= |
| Out[1]= | 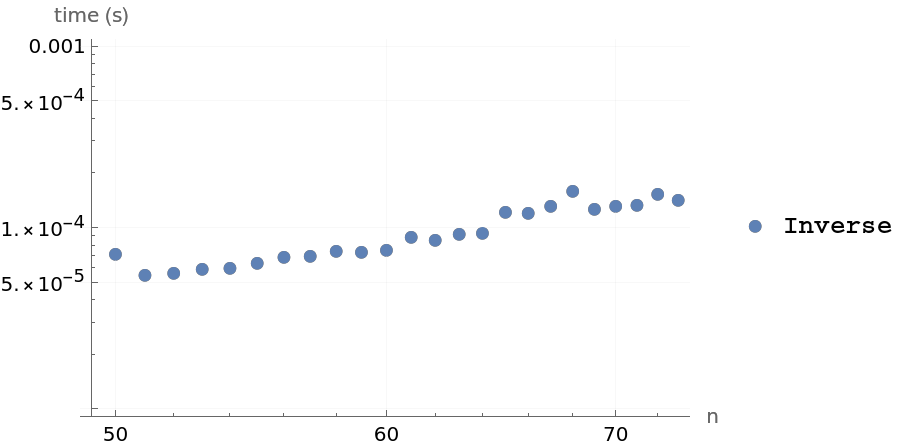 |
Get a plot for the data of a previous benchmark:
| In[2]:= |
| Out[2]= |  |
| In[3]:= |
| Out[3]= | 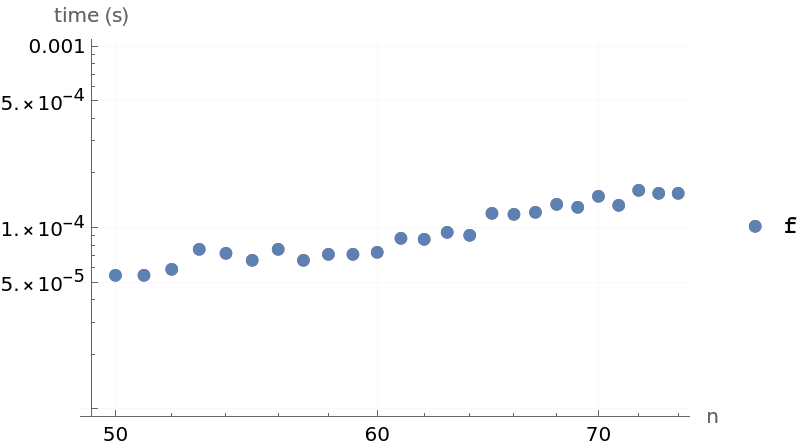 |
Use "IncludeFits" to get a fit for the data:
| In[4]:= |
| Out[4]= | 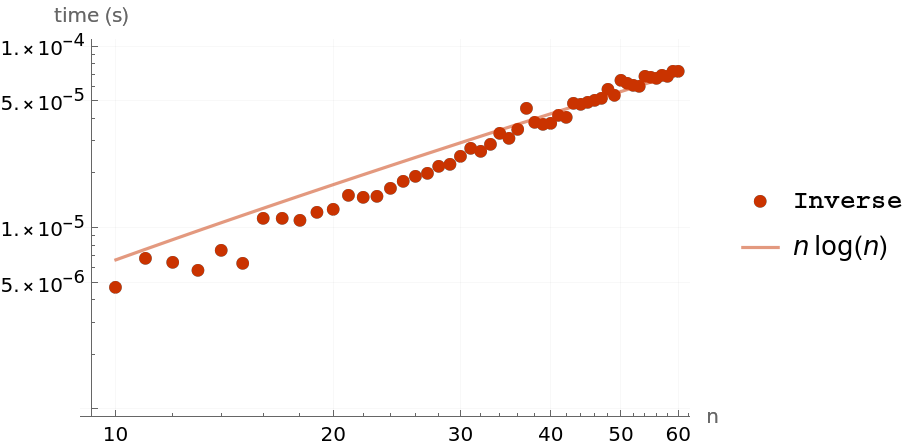 |
Wolfram Language 11.3 (March 2018) or above
This work is licensed under a Creative Commons Attribution 4.0 International License