Wolfram Function Repository
Instant-use add-on functions for the Wolfram Language
Function Repository Resource:
Perform Lloyd's algorithm to find evenly spaced points in a region
ResourceFunction["LloydAlgorithm"][pts, {{xmin,xmax},{ymin,ymax}},n] performs n iterations of Lloyd's algorithm in a rectangular region. | |
ResourceFunction["LloydAlgorithm"][pts, reg,n] performs n iterations of Lloyd's algorithm in the region reg. |
Perform five iterations of the algorithm on some random points:
| In[1]:= | ![pts = {{0.7051415661084366, 0.8127461249573649}, {
0.24818358106692706`, 0.7163485756499937}, {0.0025428587961178195`, 0.28314953970466283`}, {0.5733698624847858, 0.9737674379351713}, {
0.22813077794397185`, 0.22547353064271713`}, {0.19238874468210732`, 0.649219075575642}, {0.42688137383256564`, 0.4511465320841044}, {
0.7744365030958476, 0.11274092143618653`}, {0.6724513430791277, 0.8062991370825388}, {0.6677413538921941, 0.37679516587705786`}};
ResourceFunction["LloydAlgorithm"][pts, {{0, 1}, {0, 1}}, 5]](https://www.wolframcloud.com/obj/resourcesystem/images/acb/acbe9ccb-90e7-497a-82e5-f2f3eb097dd2/3a91c94446f37e20.png) |
| Out[2]= |
Spread 15 points evenly in a square box and visualize their neighborhood:
| In[3]:= | ![pts = {{0.7051415661084366, 0.8127461249573649}, {
0.24818358106692706`, 0.7163485756499937}, {0.0025428587961178195`, 0.28314953970466283`}, {0.5733698624847858, 0.9737674379351713}, {
0.22813077794397185`, 0.22547353064271713`}, {0.19238874468210732`, 0.649219075575642}, {0.42688137383256564`, 0.4511465320841044}, {
0.7744365030958476, 0.11274092143618653`}, {0.6724513430791277, 0.8062991370825388}, {0.6677413538921941, 0.37679516587705786`}};
newpts = ResourceFunction["LloydAlgorithm"][pts, {{0, 1}, {0, 1}}, 15];
{Show[{VoronoiMesh[pts], Graphics[Point[pts]]}], Show[{VoronoiMesh[newpts], Graphics[Point[newpts]]}]}](https://www.wolframcloud.com/obj/resourcesystem/images/acb/acbe9ccb-90e7-497a-82e5-f2f3eb097dd2/7c53994c33ef59cc.png) |
| Out[5]= | 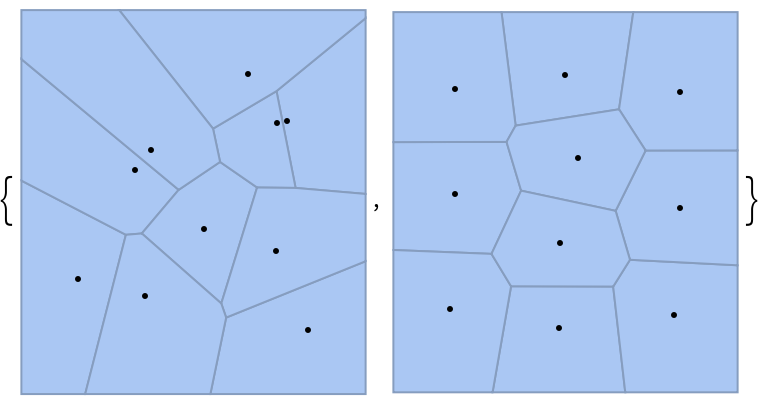 |
Perform 15 iterations in a complicated region:
| In[6]:= | ![SeedRandom[1234];
reg = Disk[{5, 5}, 5];
reg = RegionDifference[reg, Rectangle[{2, 4}, {7, 7}]];
reg = BoundaryDiscretizeRegion[reg];
p = RandomPoint[reg, 20];
p = ResourceFunction["LloydAlgorithm"][p, reg, 15];
Show[{reg, Graphics[{EdgeForm[Black], FaceForm[Gray], Black, Point[p]}]}]](https://www.wolframcloud.com/obj/resourcesystem/images/acb/acbe9ccb-90e7-497a-82e5-f2f3eb097dd2/6bc8ef7bed1f091a.png) |
| Out[7]= | 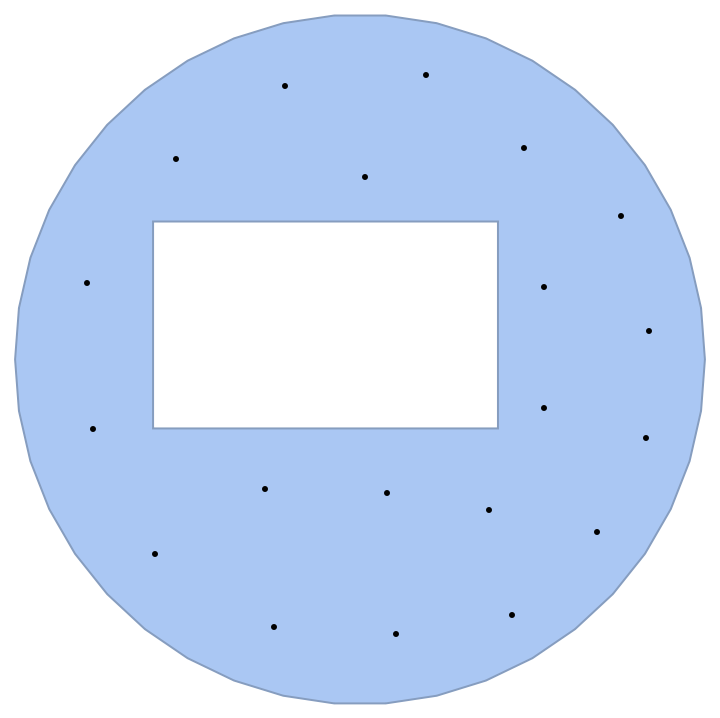 |
Perform 15 iterations in a different complicated region:
| In[8]:= | ![SeedRandom[12345];
reg = ImplicitRegion[x^4 + y^4 + 3 x^3 - 4 y <= 1, {x, y}];
reg = BoundaryDiscretizeRegion[reg];
p = RandomPoint[reg, 20];
p = ResourceFunction["LloydAlgorithm"][p, reg, 10];
Show[{reg, Graphics[Point[p]]}]](https://www.wolframcloud.com/obj/resourcesystem/images/acb/acbe9ccb-90e7-497a-82e5-f2f3eb097dd2/7f59465e5709a81e.png) |
| Out[13]= | 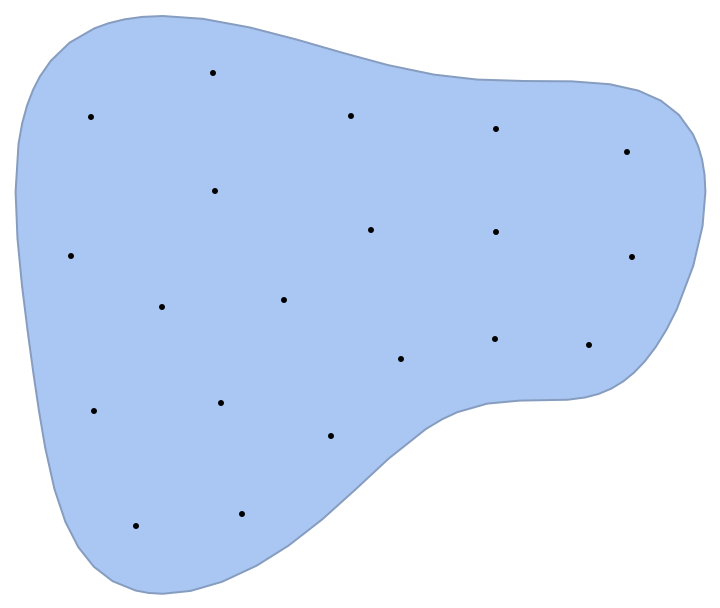 |
See how the standard deviation of the Voronoi areas changes with iterations:
| In[14]:= | ![SeedRandom[1];
bb = {{0, 1}, {0, 1}};
pts = RandomReal[{0, 1}, {10, 2}];
pts = NestList[ResourceFunction["LloydAlgorithm"][#, bb, 1] &, pts, 15];
s = StandardDeviation[
Area /@ MeshPrimitives[VoronoiMesh[#, bb], 2]] & /@ pts;
ListPlot[s, PlotRange -> All]](https://www.wolframcloud.com/obj/resourcesystem/images/acb/acbe9ccb-90e7-497a-82e5-f2f3eb097dd2/6ede444cc5e3bf95.png) |
| Out[15]= | 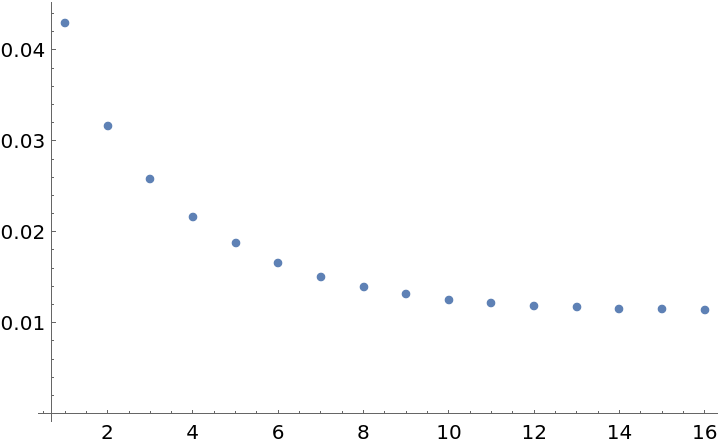 |
Visualize the evolution:
| In[16]:= |
| Out[16]= | 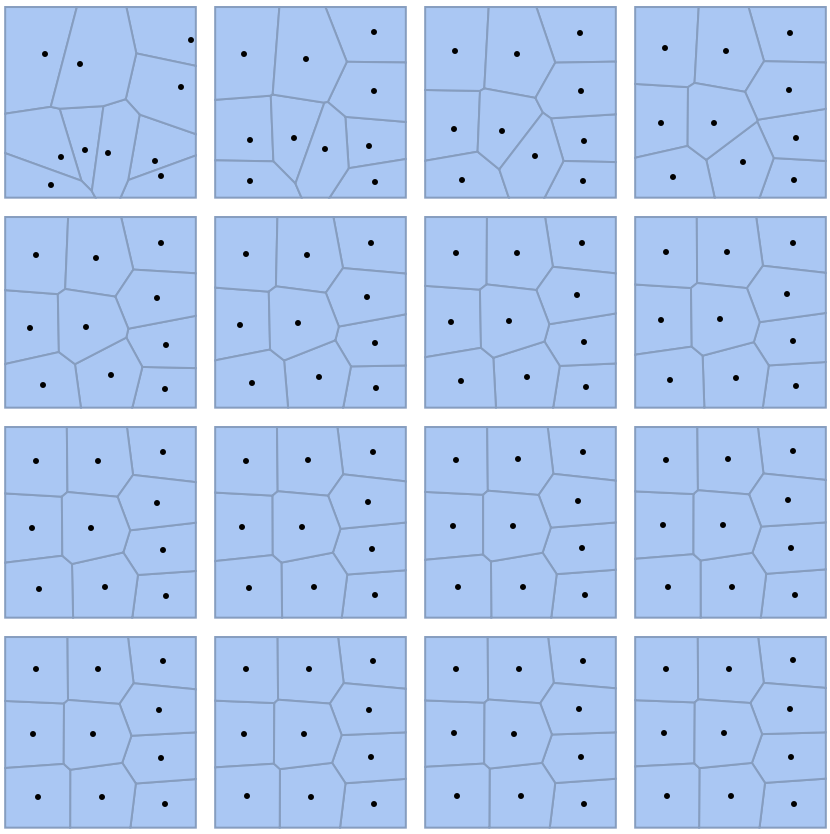 |
This work is licensed under a Creative Commons Attribution 4.0 International License