Details and Options
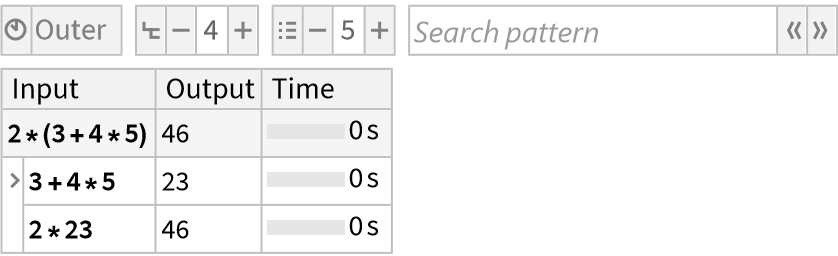
ResourceFunction["TraceView"][expr] displays an interactive view of the execution trace of the evaluation process of expr. Shown are the input and output expressions and their substeps as well as the time taken by each step.
ResourceFunction["TraceView"] is based on
TraceScan and takes all the same options.
In addition, ResourceFunction["TraceView"] accepts the following options:
| "TimesRelativeTo" | "Outer" | the reference to use for the timing bars |
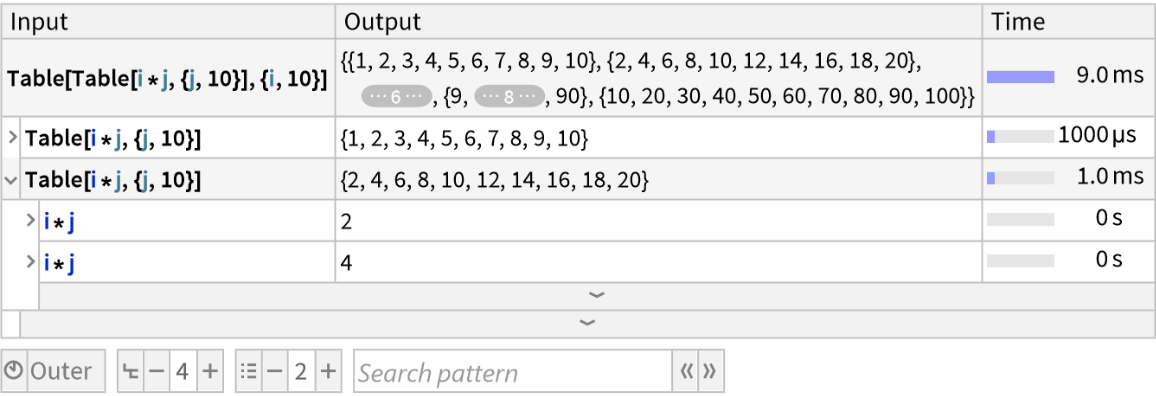
| "MaxDisplayDepth" | 4 | the maximum number of levels shown at once |
| "MaxChildDisplay" | 5 | the maximum number of substeps shown at once |
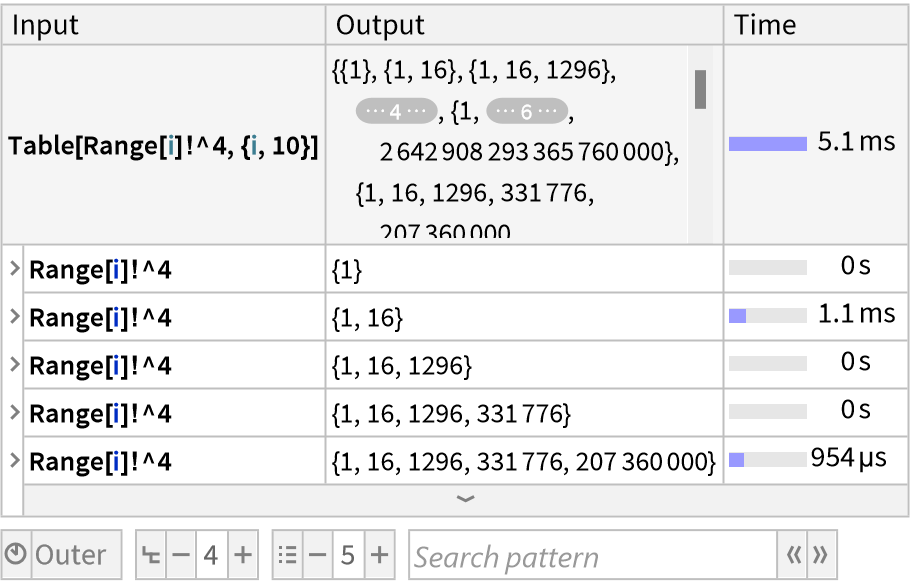
| "MaxExpressionPaneSize" | AbsoluteCurrentValue[WindowSize]/{3,6} | the maximum size of the panes containing the individual expressions (in printer's points) |
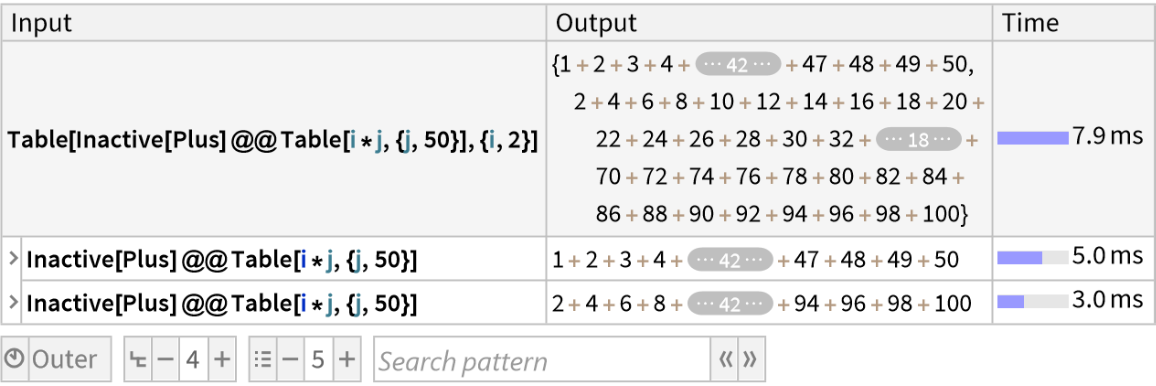
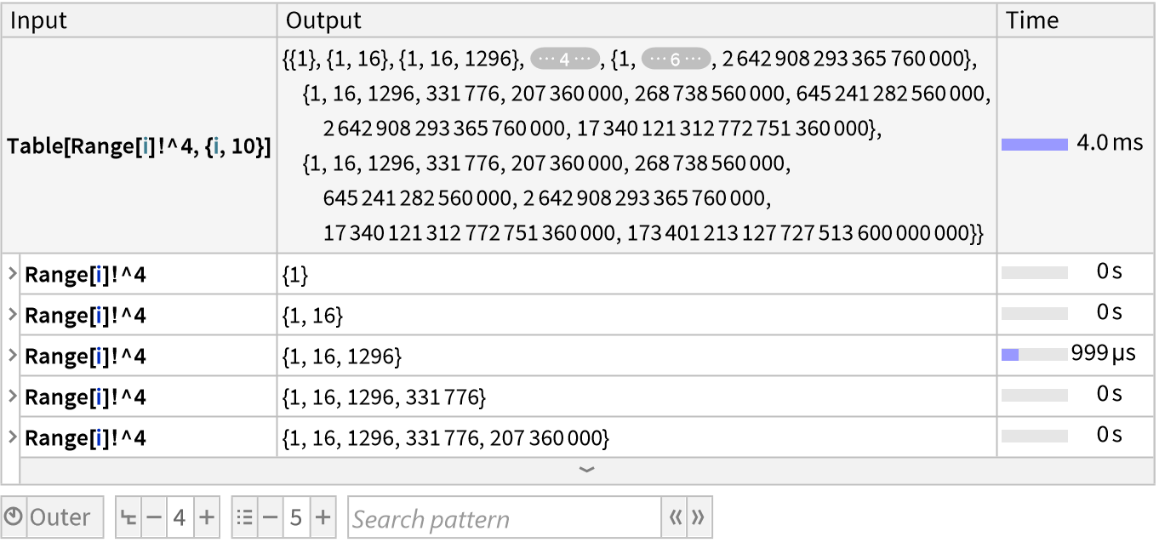
| "DefaultExpressionSizeLimit" | 1000 | the maximum size of the expressions before parts are elided |
| "ShowAllSteps" | False | whether to show trivial steps |
| "ToolbarPosition" | Bottom | the location of the toolbar |
The "TimesRelativeTo" setting can be set to the following:
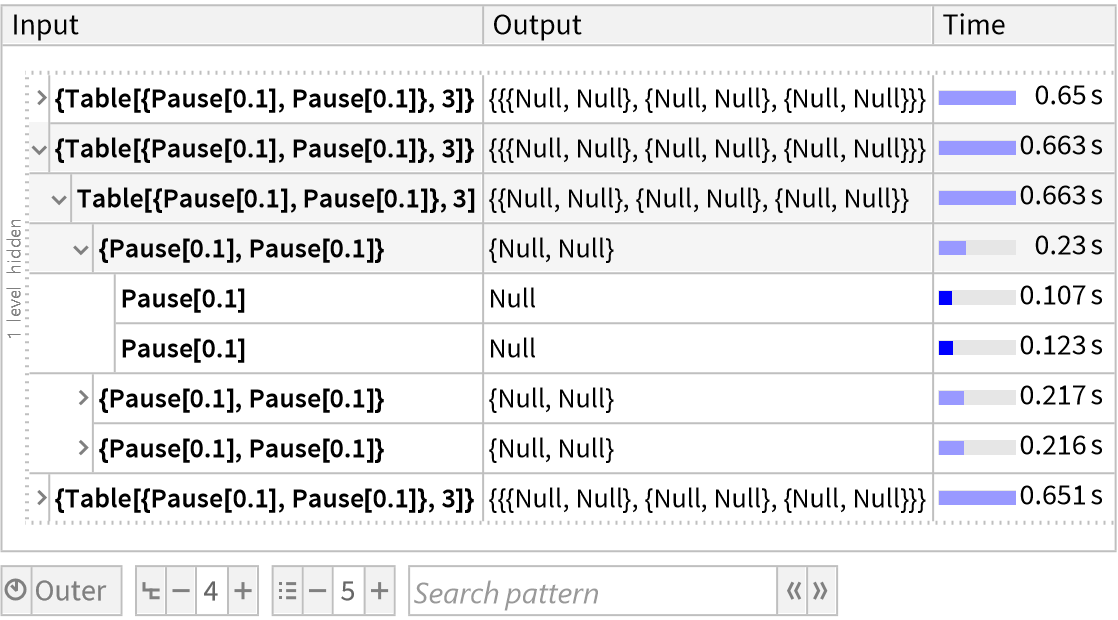
| "Outer" | show times relative to the outermost visible parent step |
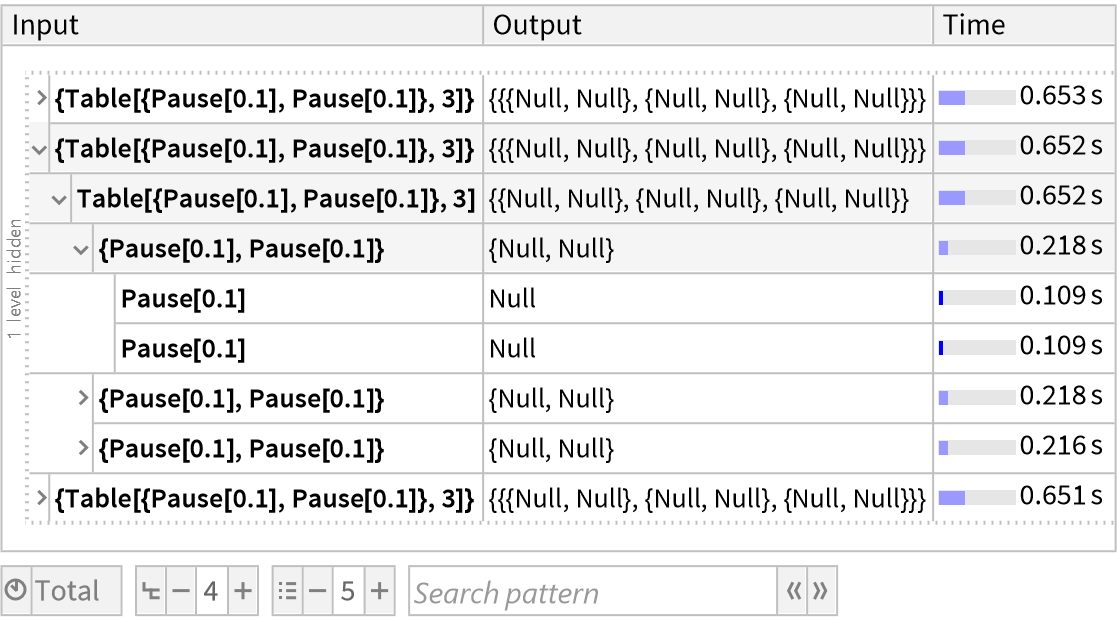
| "Total" | show times relative to the total execution time |
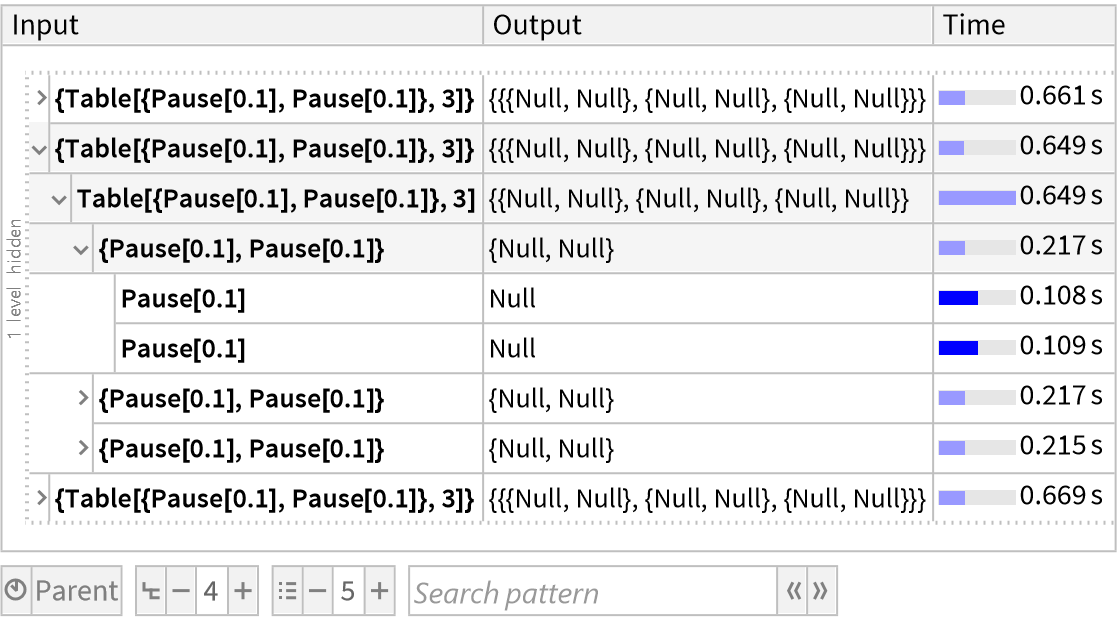
| "Parent" | show times relative to the direct parent step |
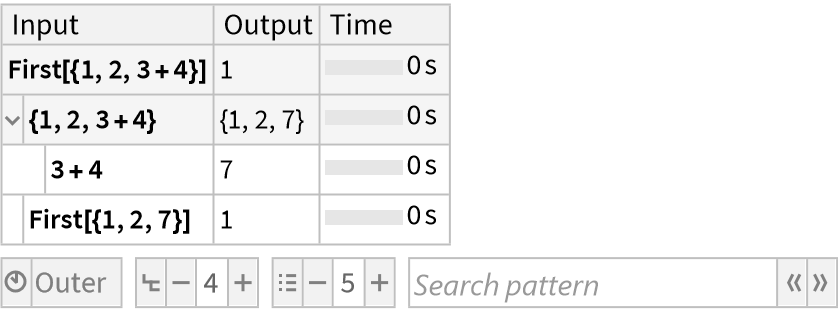
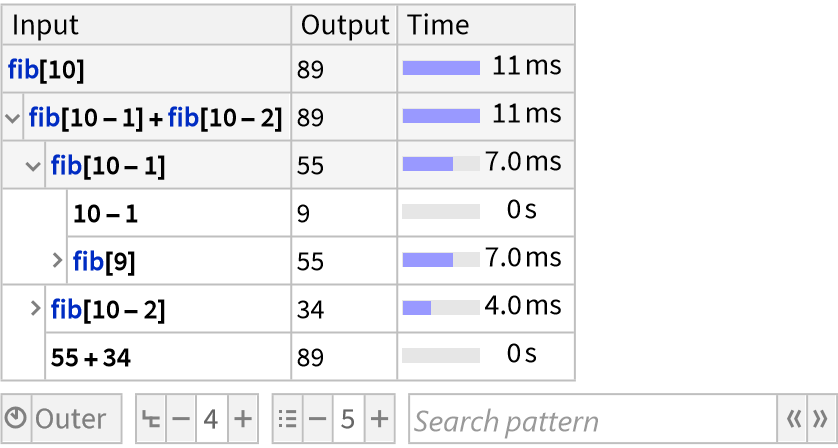
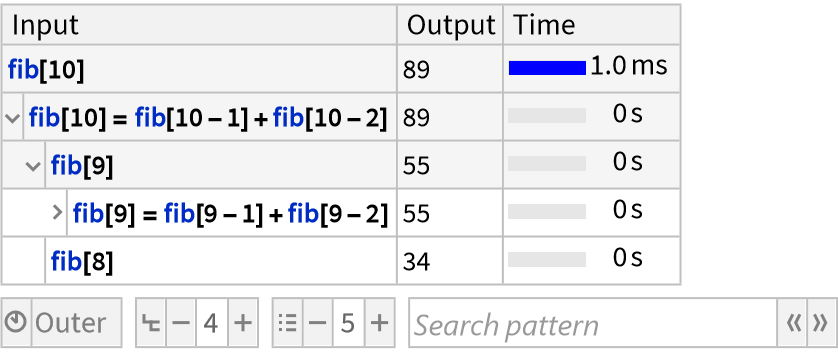
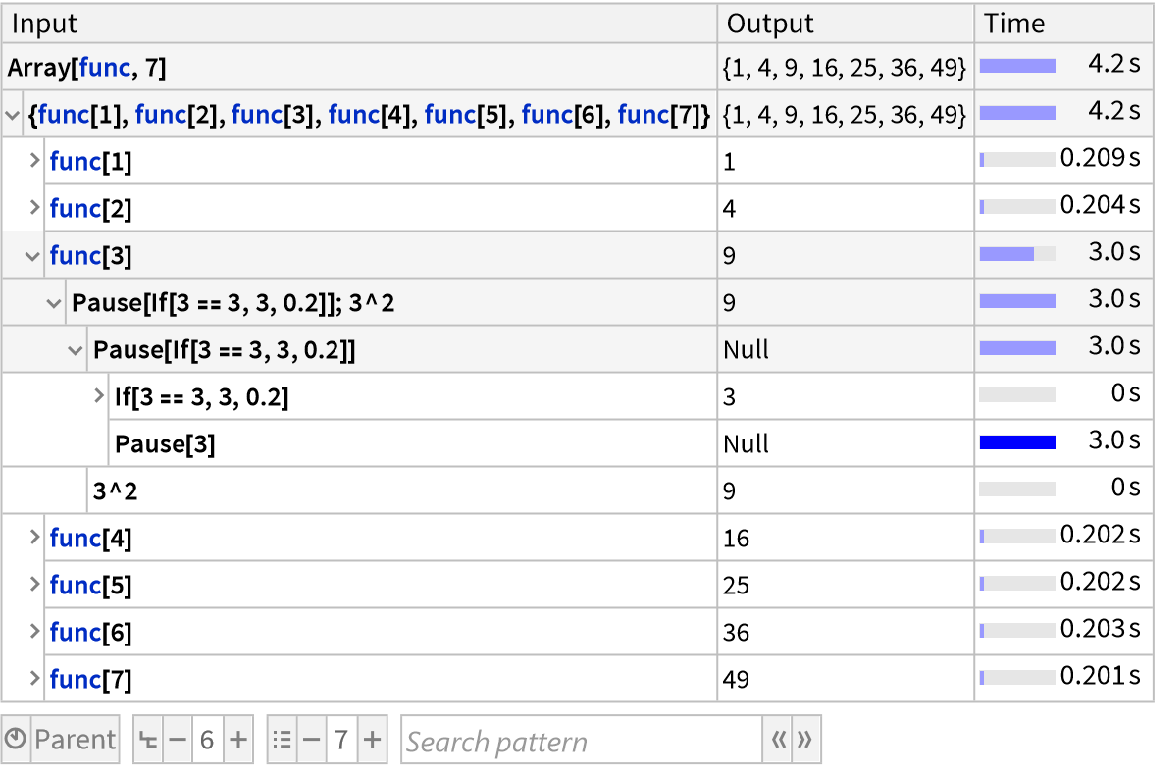
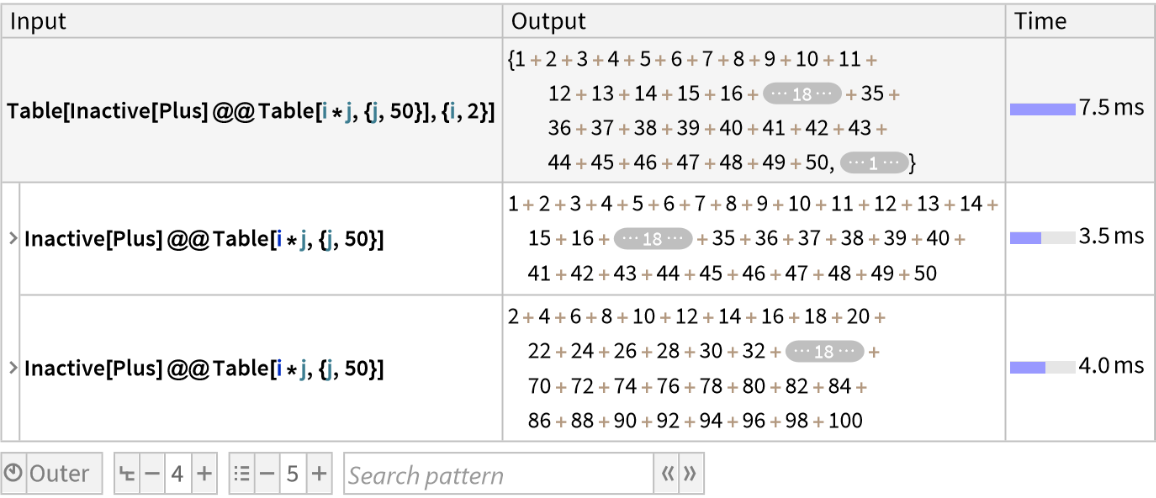
The "TimesRelativeTo" setting controls the display of the time bar shown next to the execution time of each step, where the light-blue part of the bar indicates the total time taken by a step and the dark-blue part the own-time taken by the step itself (excluding any substeps).
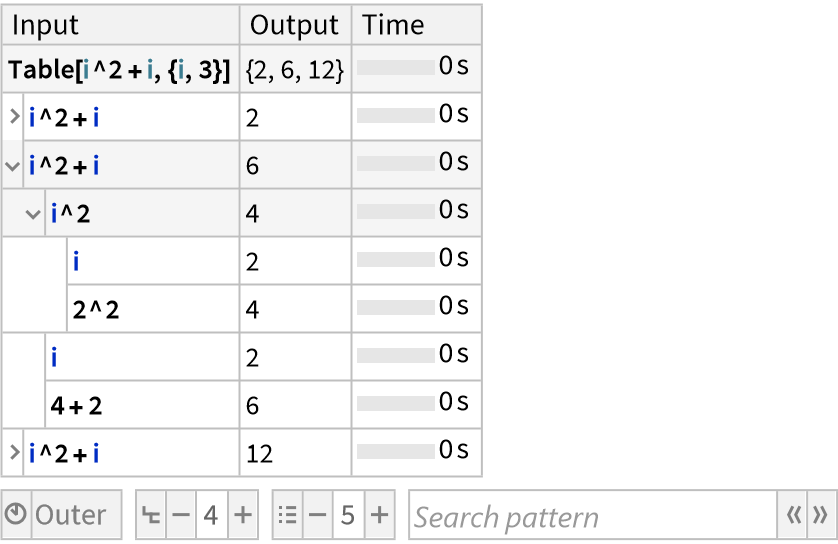
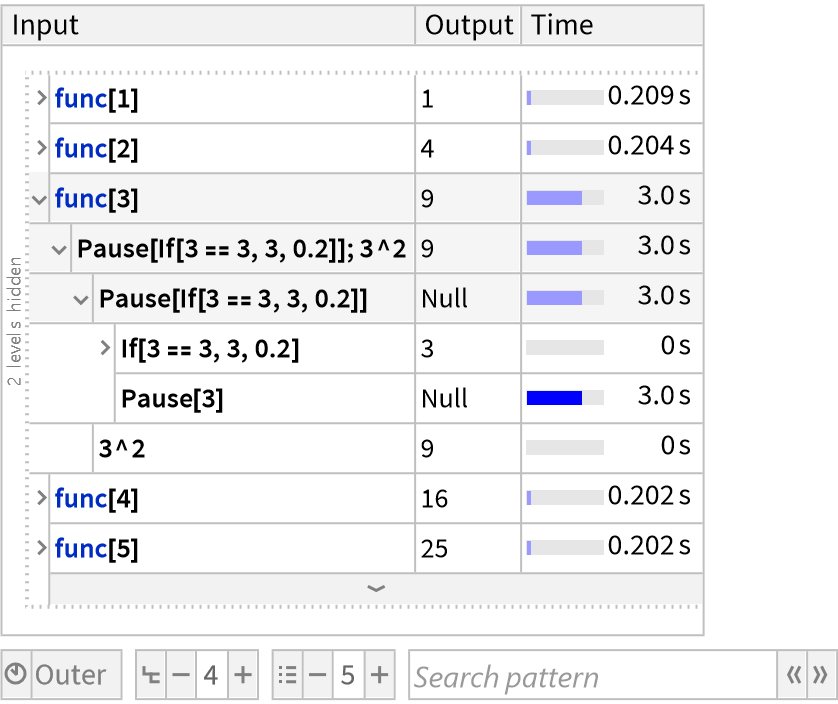
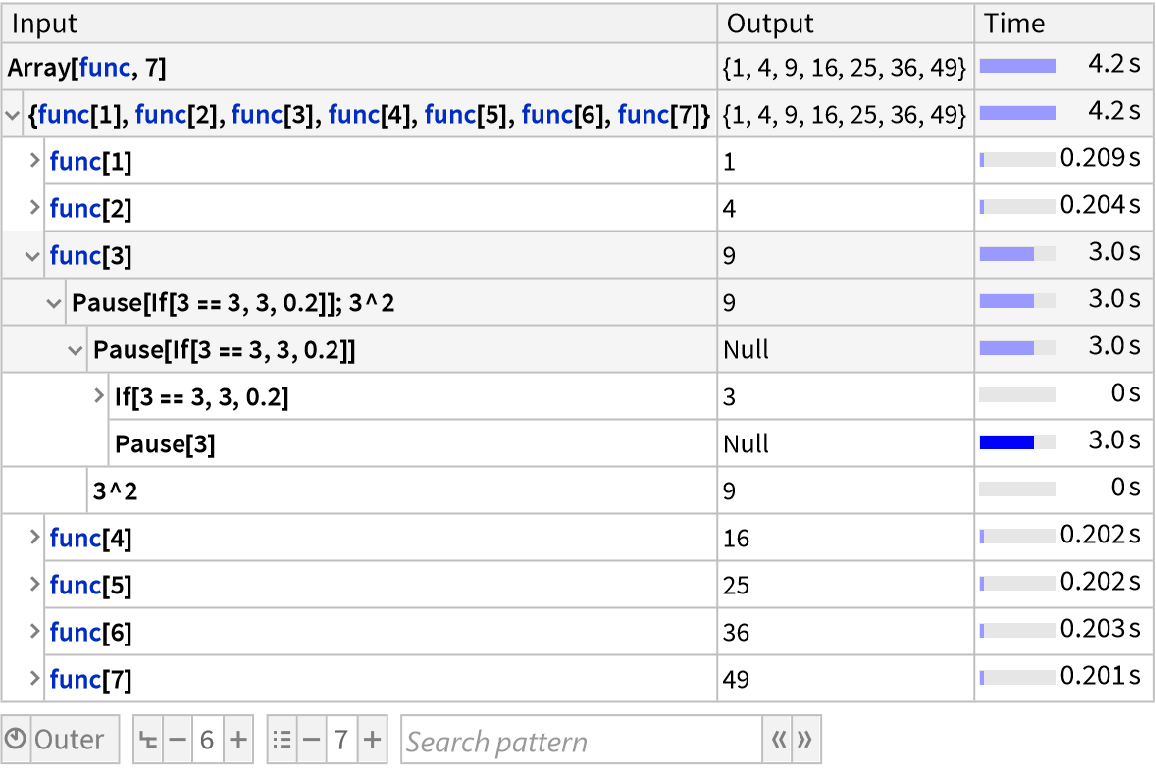
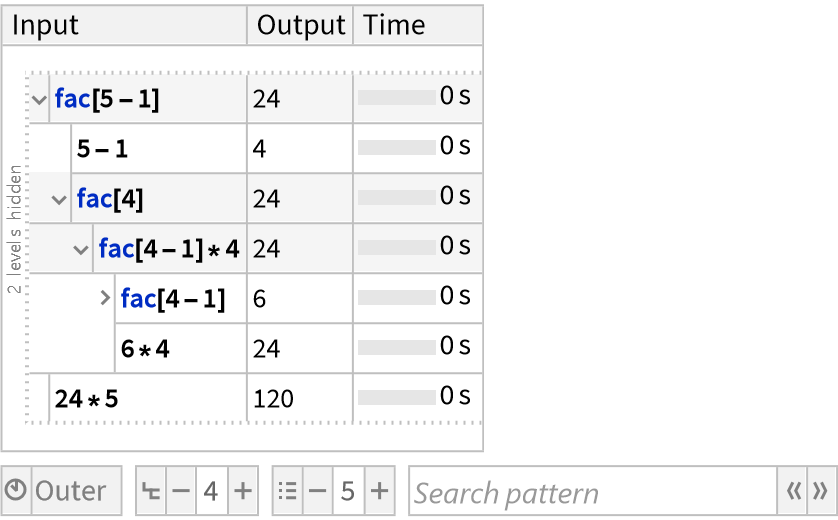
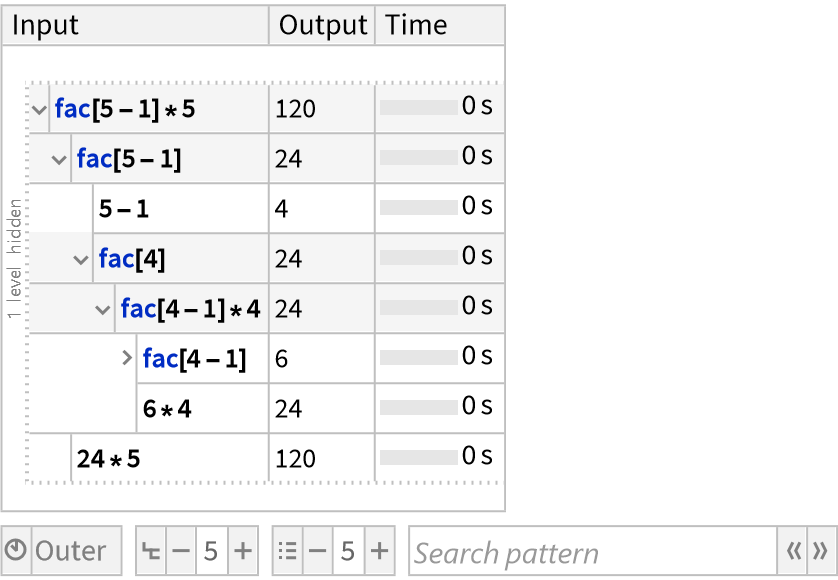
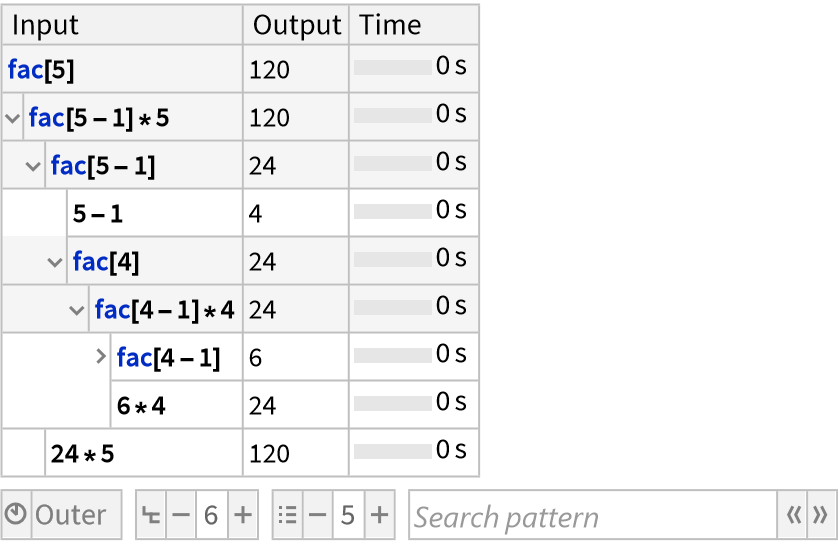
When navigating deeper into the call tree, outer levels will be omitted to keep the view responsive and reasonably sized. Closing substeps or clicking the outer edge of the view will reveal outer levels again.
The number of levels shown is controlled by the "MaxDisplayDepth" setting.
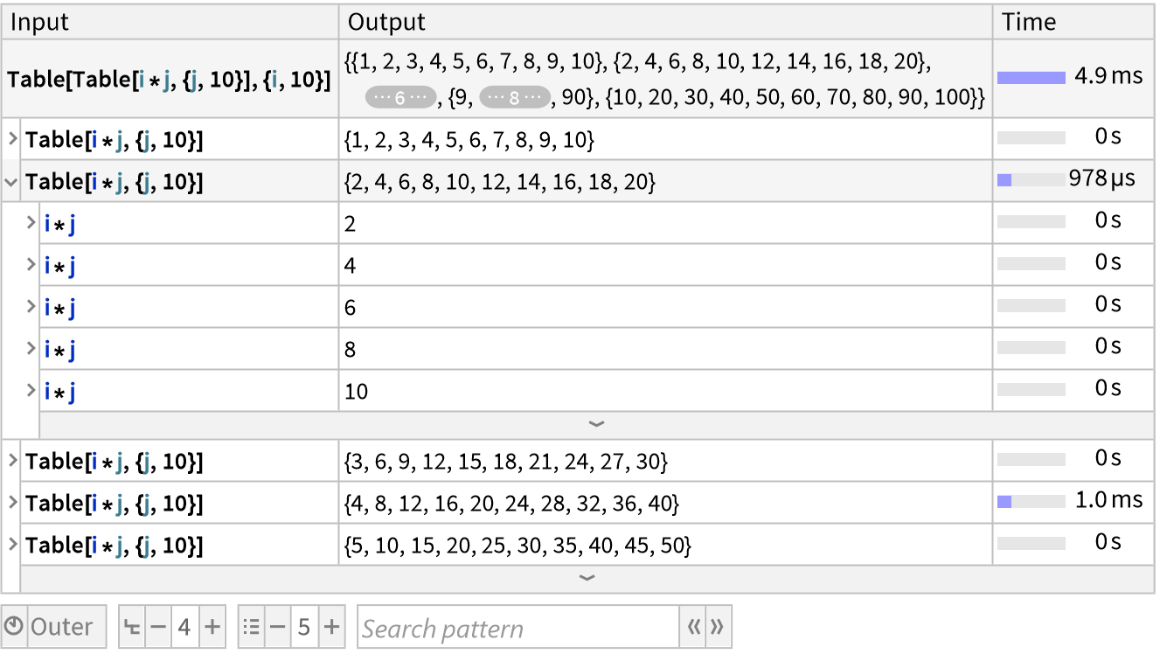
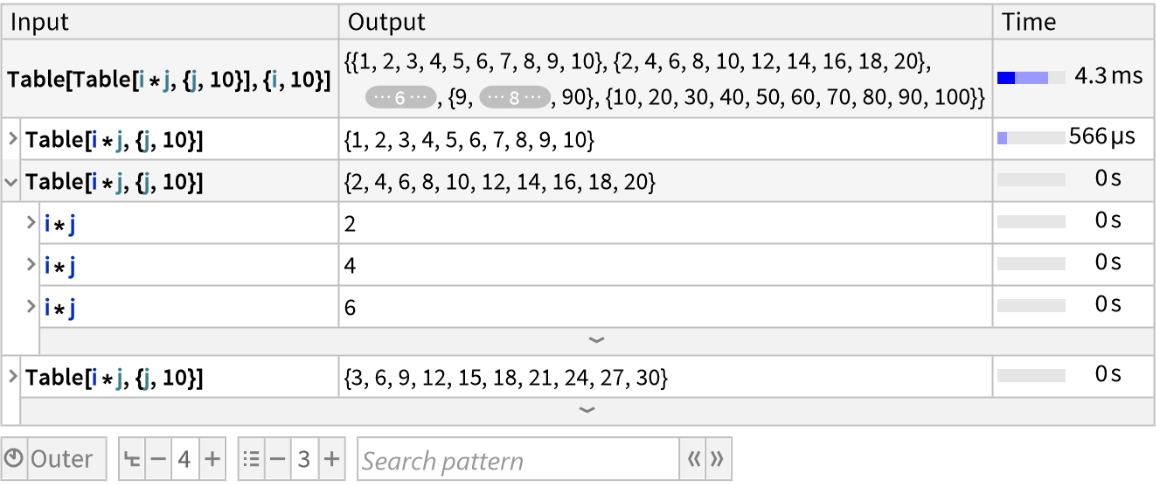
Similarly, the number of substeps displayed at once is limited by the
"MaxChildDisplay" setting. When not all substeps are shown, the buttons at the bottom/top of the list can be used to reveal more substeps. When holding the

(Windows/Linux) or

(macOS) key, an entire page of new substeps is revealed. When holding the

key instead, the view jumps to the end/beginning of the list.
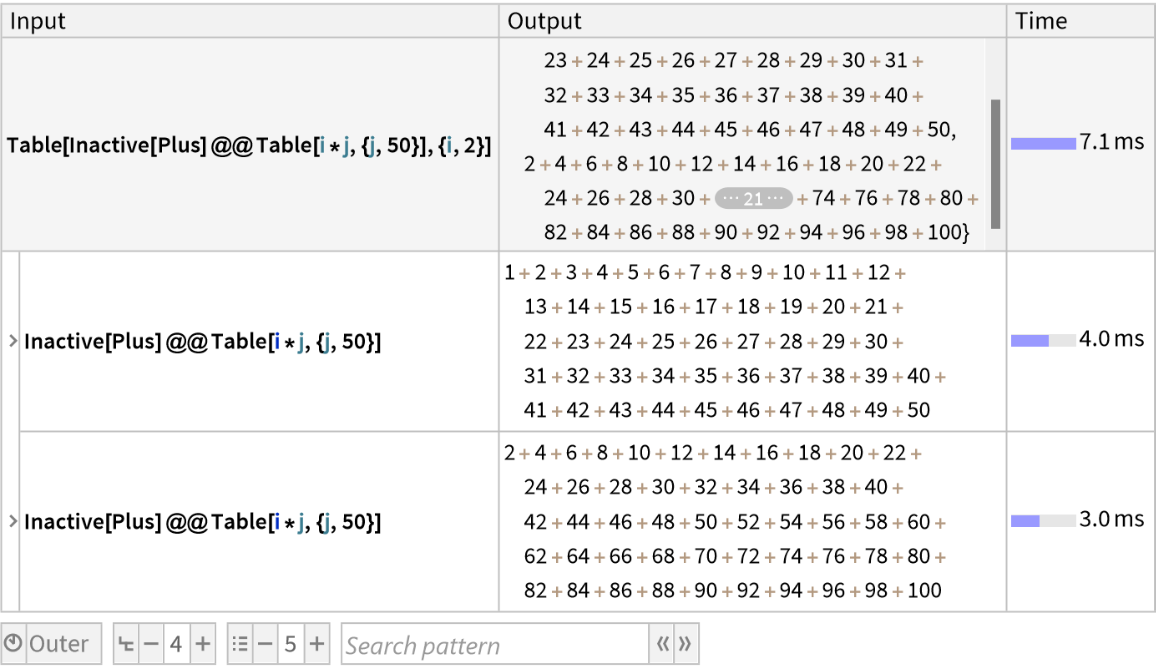
The value of the
"DefaultExpressionSizeLimit" setting corresponds roughly to the
ByteCount of the box expression shown before placeholders are inserted. The placeholders are clickable, so more of the expression can be viewed if required.
The input expressions are shown in what is effectively
InputForm, while the output is shown in
StandardForm. Both can be copied and pasted into a notebook and should be fully equivalent to the original expression. If some parts of the expression are elided, interpretation of the boxes only works in the kernel session the trace was generated in.
Input and output expressions can also be copied via the context menu entry Copy Entire Expression, which will place the entire expression into the clipboard, with any placeholders expanded and all symbol contexts included. Note that this will only work in the kernel session the trace was generated in.
While the expressions copied from a
ResourceFunction["TraceView"] output are equivalent to the original expression, symbol contexts may not be visible. To avoid this, the expression can be copied as input text via
Copy As ▶ Input Text (in the
Edit menu or context menu).
With the default setting
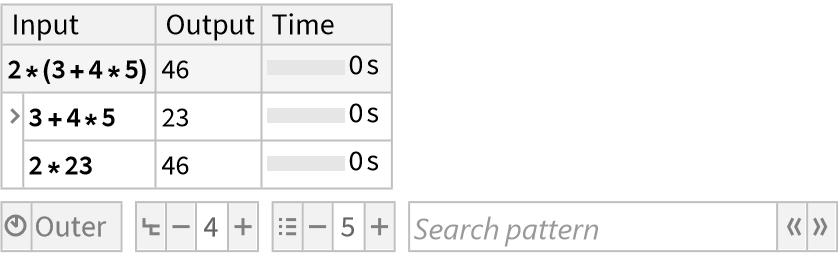
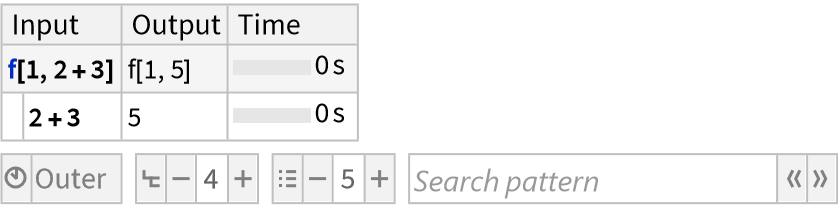
"ShowAllSteps"→False, trivial steps are automatically omitted from the trace to reduce clutter. Steps are considered trivial if they have no substeps and their input and output are the same. The resulting trace may therefore be shorter than the corresponding output from
TracePrint.
Setting
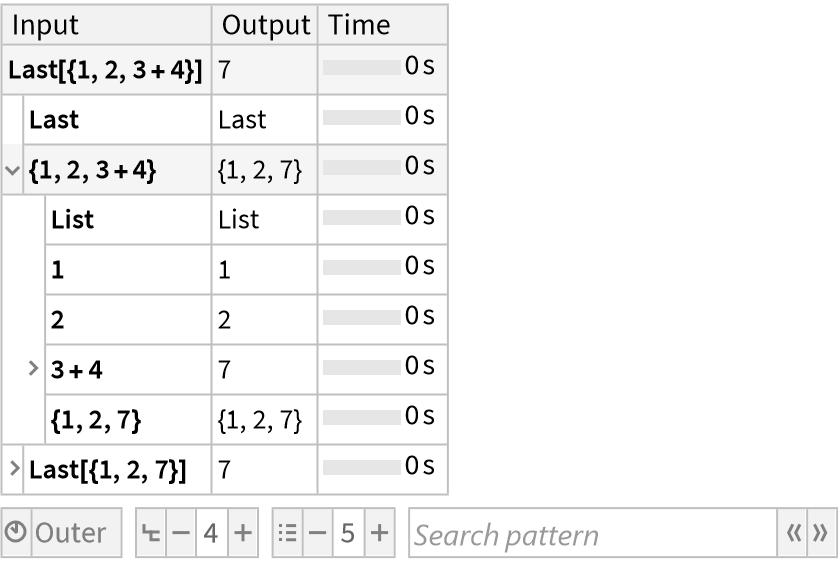
"ShowAllSteps"→True forces
ResourceFunction["TraceView"] to include all steps.
Below the main trace display, a toolbar with the most common settings is displayed to allow on-the-fly changes. The accessible settings are "TimesRelativeTo", "MaxDisplayDepth" and "MaxChildDisplay".
The toolbar also contains a search bar, which allows the trace to be searched for a given pattern. Both pattern expressions and abbreviated string patterns (such as those supported by
Names) are supported. The buttons next to the search box can be used to navigate through the matches. Additionally, pressing the

key while the cursor is inside the search field will navigate to the next match.
The setting
"ToolbarPosition" can be used to move the toolbar to the top of the view by specifying
"ToolbarPosition"→Top.
ResourceFunction["TraceView"] is designed to efficiently handle and display large execution traces, with traces up to 1,000,000 steps being processed in well below a minute, and with no slowdown during the interactive exploration of the trace.
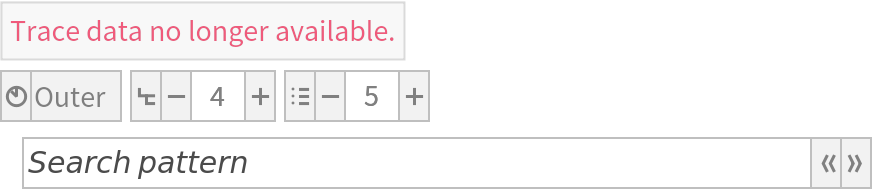
In order to maintain acceptable performance levels for large traces, the trace output is not stored in the notebook and will not be available in future kernel sessions.
Although
ResourceFunction["TraceView"] is optimized for low overhead, the timings shown might not be entirely accurate, especially for many fast steps. Limiting the number of profiled steps, for example using the
form argument or the
TraceDepth option, can provide more accurate results.
![func[x_] := (Pause@If[x == 3(*simulate a slow case*), 3, 0.2]; x^2)
ResourceFunction[
"TraceView", ResourceSystemBase -> "https://www.wolframcloud.com/obj/resourcesystem/api/1.0"][Array[func, 7]]](https://www.wolframcloud.com/obj/resourcesystem/images/a7e/a7e702e1-3640-4645-a442-72c914bae8be/6fa06c784effa21a.png)
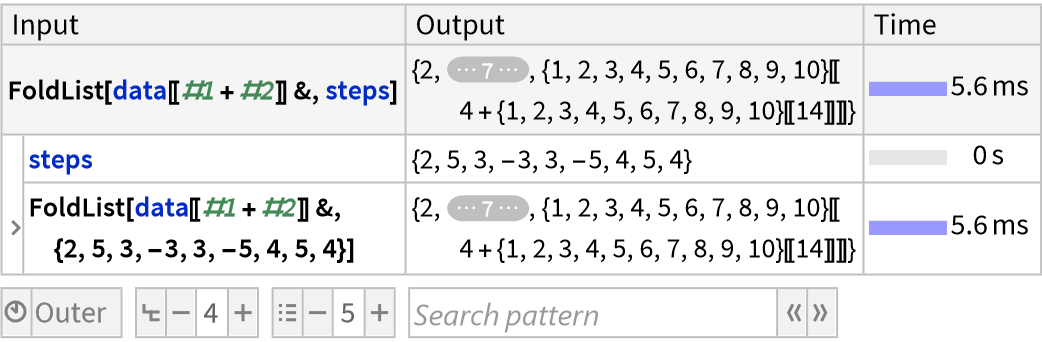
![SeedRandom[3];
steps = RandomInteger[{-5, 5}, 9]
data = Range@10;
res = FoldList[data[[# + #2]] &, steps];](https://www.wolframcloud.com/obj/resourcesystem/images/a7e/a7e702e1-3640-4645-a442-72c914bae8be/3508a362754ff653.png)
![ResourceFunction[
"TraceView", ResourceSystemBase -> "https://www.wolframcloud.com/obj/resourcesystem/api/1.0"][
Table[Inactive[Plus] @@ Table[i j, {j, 50}], {i, 2}], "DefaultExpressionSizeLimit" -> 2500]](https://www.wolframcloud.com/obj/resourcesystem/images/a7e/a7e702e1-3640-4645-a442-72c914bae8be/39e2430a67cdb494.png)
![ResourceFunction[
"TraceView", ResourceSystemBase -> "https://www.wolframcloud.com/obj/resourcesystem/api/1.0"][
Table[Inactive[Plus] @@ Table[i j, {j, 50}], {i, 2}], "DefaultExpressionSizeLimit" -> 250]](https://www.wolframcloud.com/obj/resourcesystem/images/a7e/a7e702e1-3640-4645-a442-72c914bae8be/5b9902fce780f7de.png)