Wolfram Function Repository
Instant-use add-on functions for the Wolfram Language
Function Repository Resource:
Modify graphics to appear hand-drawn in the style of the xkcd cartoon series
ResourceFunction["XKCDConvert"][graphics] modifies graphics to appear hand-drawn in the style of the xkcd cartoon series. |
Wolfram Language 11.3 (March 2018) or above
This work is licensed under a Creative Commons Attribution 4.0 International License
![ResourceFunction["XKCDConvert"][
BarChart[{10, 1}, ChartLabels -> {"XKCD", "Others"}, PlotLabel -> "Popularity of questions on MMA.SE", Ticks -> {None, {{1, "Min"}, {10, "Max"}}}]]](https://www.wolframcloud.com/obj/resourcesystem/images/574/5749c873-a839-4e5a-962d-80e86ce18d70/06255b4926b78904.png)

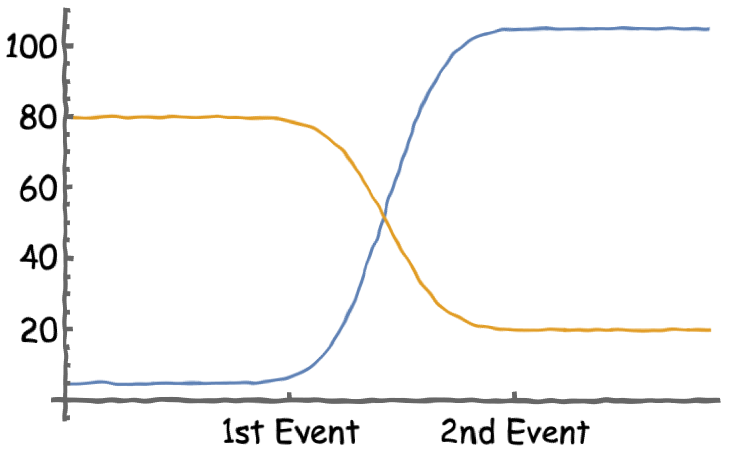
![f1[x_] := 5 + 50 (1 + Erf[x - 5]);
f2[x_] := 20 + 30 (1 - Erf[x - 5]);
ResourceFunction["XKCDConvert"][
Plot[{f1[x], f2[x]}, {x, 0, 10}, Ticks -> {{{3.5, "1st Event"}, {7, "2nd Event"}}, Automatic}]]](https://www.wolframcloud.com/obj/resourcesystem/images/574/5749c873-a839-4e5a-962d-80e86ce18d70/00ce16824c3e7055.png)
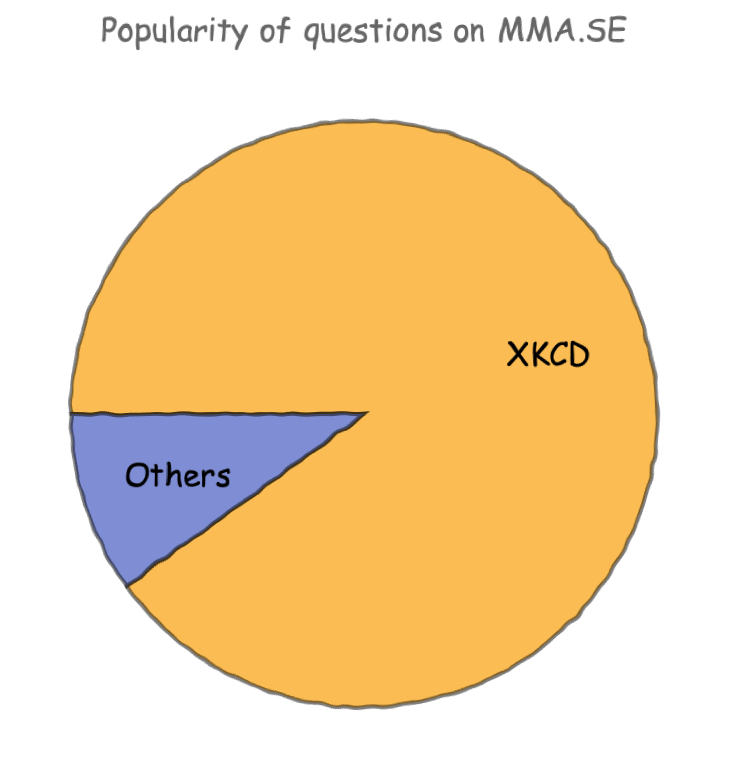
![ResourceFunction["XKCDConvert"][
PieChart[{9, 1}, ChartLabels -> {"XKCD", "Others"}, PlotLabel -> "Popularity of questions on MMA.SE"]]](https://www.wolframcloud.com/obj/resourcesystem/images/574/5749c873-a839-4e5a-962d-80e86ce18d70/61eb307fdd0ac8ae.png)