Wolfram Function Repository
Instant-use add-on functions for the Wolfram Language
Function Repository Resource:
Create a simple bar chart that shows the number of items in a list that fit set criteria compared to those that do not
ResourceFunction["WinLossChart"][{item1,item2, …,itemn}] generates a win/loss chart based on the itemi. |
| "WinLossPatterns" | {_?Positive,_?NonPositive} | patterns that correspond to wins/losses |
| "AxisLabels" | {"Wins","Losses"} | y-axis chart labels |
| "Colors" | {Green,Red} | colors of the bars |
Generate a list of random integers:
| In[1]:= |
| Out[1]= |
Plot them in a win/loss chart:
| In[2]:= |
| Out[2]= | 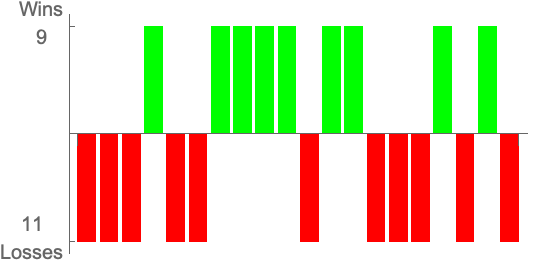 |
The win/loss criteria can be changed with the "WinLossPatterns" option:
| In[3]:= |
| In[4]:= |
| Out[4]= | 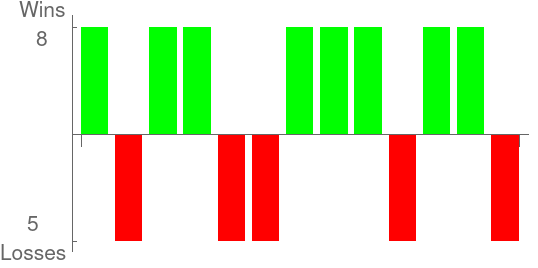 |
The axis labels can be changed to better reflect the contents of the chart:
| In[5]:= |
| In[6]:= |
| Out[6]= | 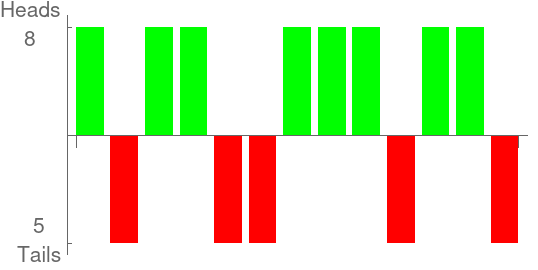 |
The colors of the bars can be changed:
| In[7]:= |
| In[8]:= |
| Out[8]= | 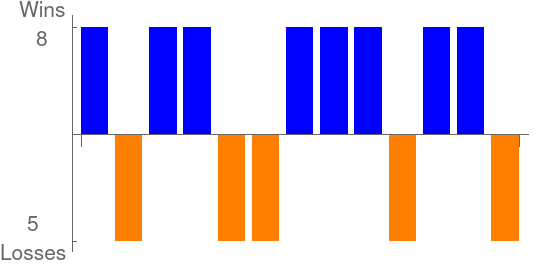 |
Non-numeric data is left blank in the chart produced by WinLossChart:
| In[9]:= |
| Out[9]= | 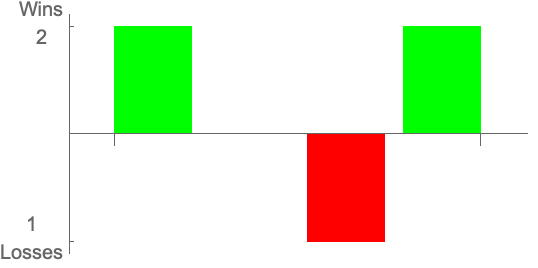 |
Compare two soccer teams' results over a season:
| In[10]:= | ![tot = {w, d, l, d, w, l, w, l, d, l, d, d, w, w, l, w, w, l, w, d, l, l, d, w, w};
ars = {w, w, l, d, d, w, d, w, l, d, d, l, d, d, l, w, l, d, d, l, w, d, d, d, d};
Grid[{{"Tottenham Hotspurs FC", "Arsenal FC"}, {ResourceFunction["WinLossChart"][tot, "Rules" -> {w, l}], ResourceFunction["WinLossChart"][ars, "Rules" -> {w, l}]}}]](https://www.wolframcloud.com/obj/resourcesystem/images/7fd/7fd420b6-5ab3-4e98-91d6-56a9b09b8f0b/3398b68b481a97c4.png) |
| Out[10]= | 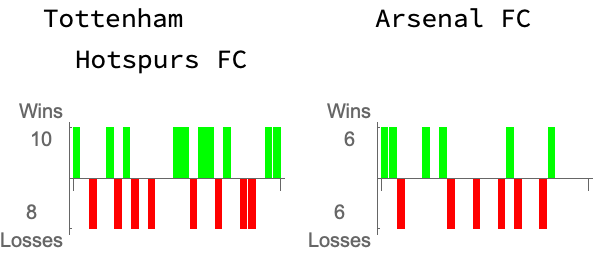 |
This work is licensed under a Creative Commons Attribution 4.0 International License