Details and Options
The
region should define a geographic region on the Earth. The
region may be given as a combination of
GeoGraphics primitives such as
GeoDisk,
GeoPolygon, and
GeoPath, geographic
Entity[…] and
EntityClass[…] objects, or individual
GeoPosition locations. For extended geographic entities, the
"Polygon" property is used. For point-like entities, the
"Position" property is used.
Results encompass the box containing the geographic region.
Weather properties available for vector and stream plots include:
| "WindDirection" | wind direction in degrees |
| "WindSpeed" | wind speed |
Weather properties available for density and contour plots include:
| "CloudCoverFraction" | fraction of the sky obscured by cloud cover |
| "Humidity" | relative humidity |
| "PrecipitationAmount" | precipitation amount |
| "PrecipitationRate" | average precipitation rate |
| "Pressure" | barometric pressure |
| "Temperature" | temperature |
| "WindChill" | wind chill temperature |
| "WindSpeed" | wind speed |
ResourceFunction["WeatherRegionPlot"]["WeatherProperties"] returns the properties for ResourceFunction["WeatherRegionPlot"].
The plottype formats include:
ResourceFunction["WeatherRegionPlot"]["OutputTypes"] returns the valid format types.
ResourceFunction["WeatherRegionPlot"] takes
date to be given by
$TimeZone unless otherwise specified by a
DateObject.
When
date is omitted, results use the latest recorded values which can vary in age. Results are interpolated for the specific
date when specified. Dates in the future use
WeatherForecastData and are available up to a week in the future.
ResourceFunction["WeatherRegionPlot"] has the same options as specified plottype with the following additions and changes:
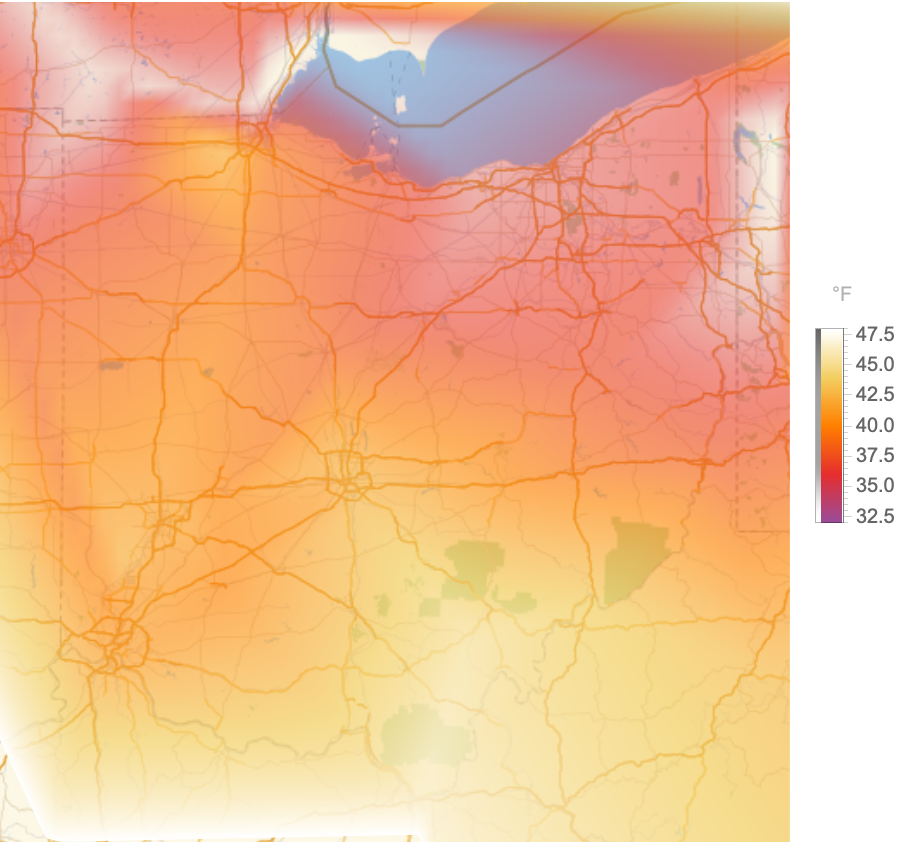
![ResourceFunction["WeatherRegionPlot"][
Entity["AdministrativeDivision", {"Ohio", "UnitedStates"}], "Temperature", GeoDensityPlot]](https://www.wolframcloud.com/obj/resourcesystem/images/2aa/2aa73ac6-023c-4c90-aa46-e3dc0a3dddb6/1d130ac566c3d17e.png)
![ResourceFunction["WeatherRegionPlot"][
Entity["AdministrativeDivision", {"Delaware", "UnitedStates"}], "Humidity", DateObject[Yesterday, TimeObject[{12, 0, 0}]], "Data"]](https://www.wolframcloud.com/obj/resourcesystem/images/2aa/2aa73ac6-023c-4c90-aa46-e3dc0a3dddb6/3c4221b011fb227d.png)

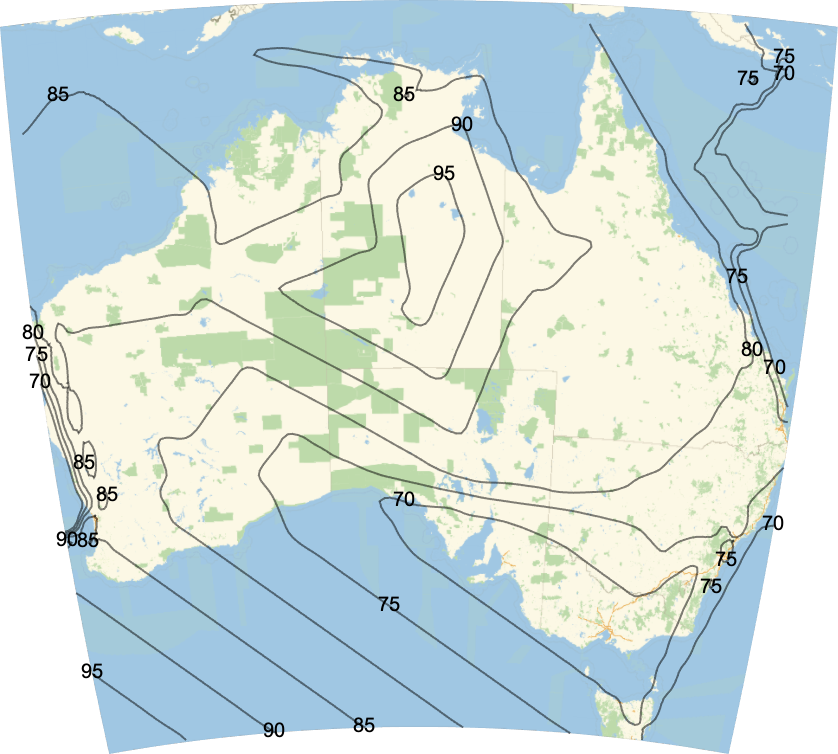
![ResourceFunction["WeatherRegionPlot"][
Entity["Country", "Australia"], "Temperature", DateObject[{2020, 1, 15, 12, 0, 0}], GeoContourPlot]](https://www.wolframcloud.com/obj/resourcesystem/images/2aa/2aa73ac6-023c-4c90-aa46-e3dc0a3dddb6/1f3c27b1fee3415a.png)
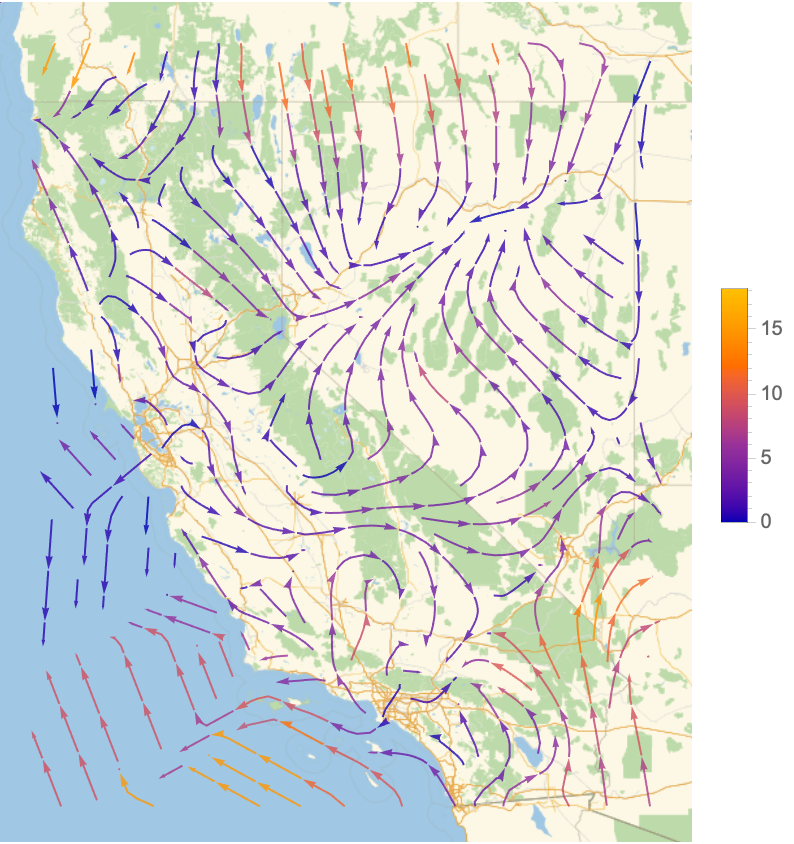
![ResourceFunction["WeatherRegionPlot"][
Entity["AdministrativeDivision", {"California", "UnitedStates"}], "WindDirection", DateObject[{2020, 1, 1, 1, 0, 0}], GeoStreamPlot]](https://www.wolframcloud.com/obj/resourcesystem/images/2aa/2aa73ac6-023c-4c90-aa46-e3dc0a3dddb6/1748c6950c35b7aa.png)
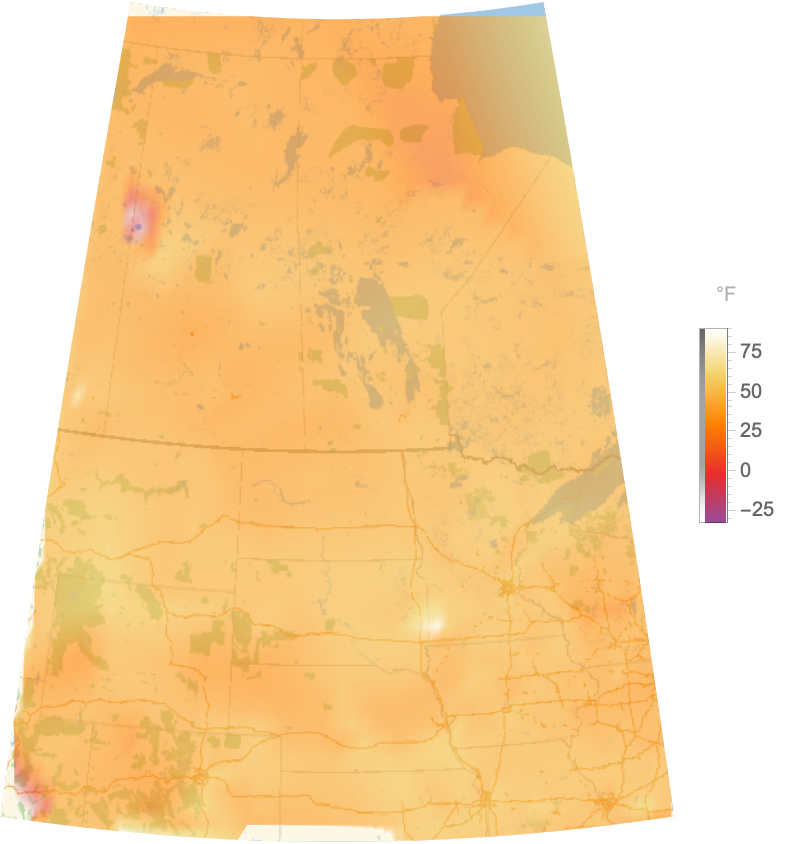
![regions = {GeoPolygon[{{50, -100}, {50, -90}, {40, -90}, {50, -100}}],
GeoPolygon[{{60, -110}, {60, -100}, {50, -100}, {60, -110}}]};
ResourceFunction[
"WeatherRegionPlot"][regions, "Temperature", GeoDensityPlot]](https://www.wolframcloud.com/obj/resourcesystem/images/2aa/2aa73ac6-023c-4c90-aa46-e3dc0a3dddb6/7a87e3d24650ea63.png)
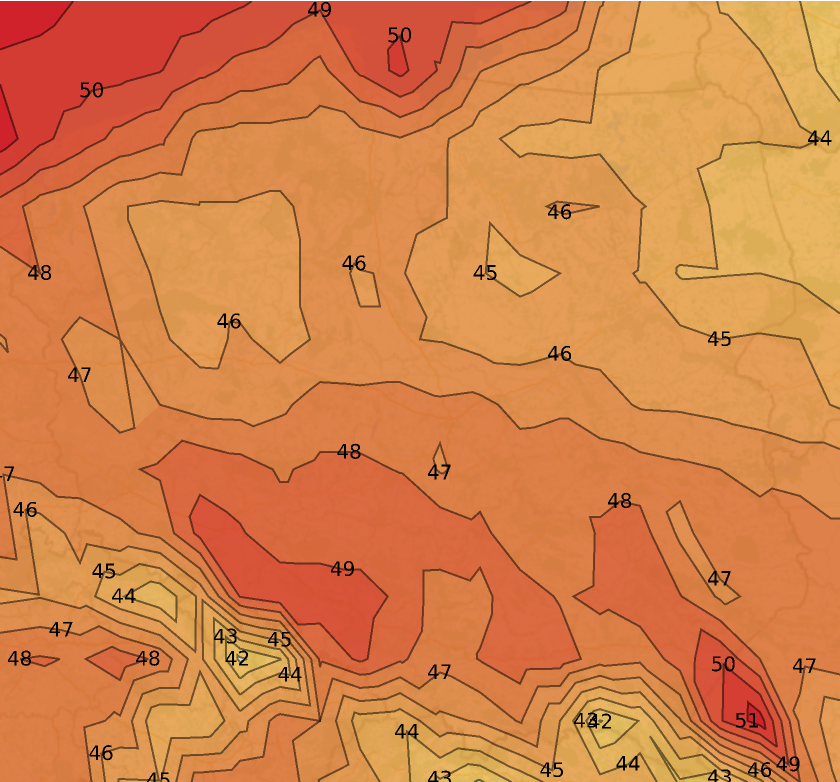
![ResourceFunction["WeatherRegionPlot"][
Entity["Country", "Poland"], "Temperature", DateObject[Tomorrow, TimeObject[{15, 0, 0}]], GeoContourPlot, ContourShading -> True, ColorFunction -> "TemperatureMap"]](https://www.wolframcloud.com/obj/resourcesystem/images/2aa/2aa73ac6-023c-4c90-aa46-e3dc0a3dddb6/265f6dd6abd0e02c.png)
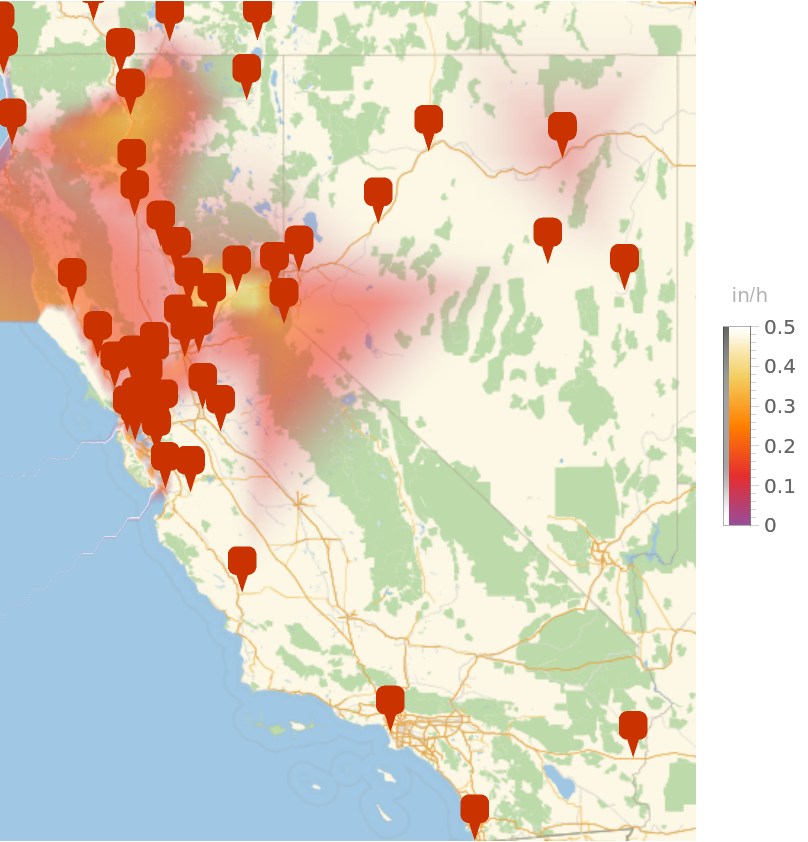
![ResourceFunction["WeatherRegionPlot"][
Entity["AdministrativeDivision", {"California", "UnitedStates"}], "PrecipitationRate", DateObject[{2021, 10, 24, 17, 0, 0}, TimeZone -> Entity["TimeZone", "America/Los_Angeles"]], GeoDensityPlot, ShowWeatherStations -> True]](https://www.wolframcloud.com/obj/resourcesystem/images/2aa/2aa73ac6-023c-4c90-aa46-e3dc0a3dddb6/40b62d8af4847912.png)
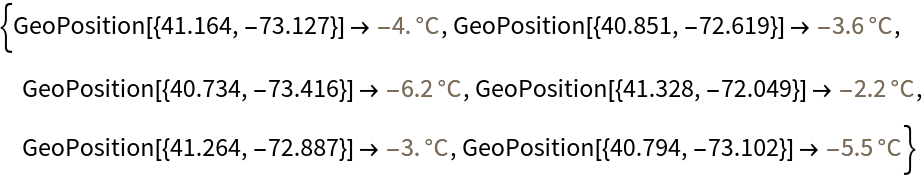
![ResourceFunction["WeatherRegionPlot"][
Entity["AdministrativeDivision", {"SuffolkCounty", "NewYork", "UnitedStates"}], "WindChill", DateObject[{2001, 1, 27, 11, 28, 0}], "Data"]](https://www.wolframcloud.com/obj/resourcesystem/images/2aa/2aa73ac6-023c-4c90-aa46-e3dc0a3dddb6/351d4aef4e182019.png)

![ResourceFunction["WeatherRegionPlot"][
Entity["AdministrativeDivision", {"SuffolkCounty", "NewYork", "UnitedStates"}], "WindChill", DateObject[{2001, 1, 27, 11, 28, 0}], "Data", UnitSystem -> "Metric"]](https://www.wolframcloud.com/obj/resourcesystem/images/2aa/2aa73ac6-023c-4c90-aa46-e3dc0a3dddb6/1f6c8cd934be87e0.png)
![ResourceFunction["WeatherRegionPlot"][
Entity["AdministrativeDivision", {"California", "UnitedStates"}], "WindDirection", Now, GeoDensityPlot]](https://www.wolframcloud.com/obj/resourcesystem/images/2aa/2aa73ac6-023c-4c90-aa46-e3dc0a3dddb6/4653a493fb826885.png)
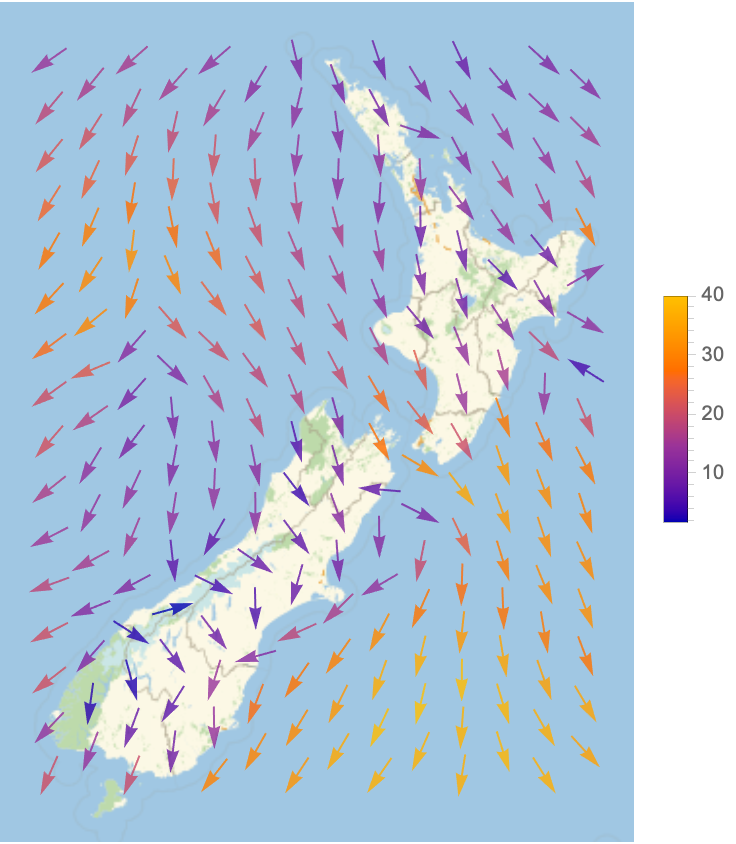
![ResourceFunction["WeatherRegionPlot"][
Entity["AdministrativeDivision", {"California", "UnitedStates"}], "Temperature", GeoVectorPlot]](https://www.wolframcloud.com/obj/resourcesystem/images/2aa/2aa73ac6-023c-4c90-aa46-e3dc0a3dddb6/653ded42b654253b.png)