Wolfram Function Repository
Instant-use add-on functions for the Wolfram Language
Function Repository Resource:
Visualize a graph with scaled vertex size based on custom graph-related measures
ResourceFunction["VertexSizeScaledGraph"][graph] visualize a graph with scaled VertexSize based on on custom graph related measures. |
| "MaxVertexSize" | 1 | maximum size of a vertex |
| "VertexSizeScalingFunction" | Automatic | how VertexSize is scaled |
| "VertexSizeFunction" | (VertexDegree[#] &) | function to scale the VertexSize |
| "VertexColoringFunction" | Automatic | function to color the vertices |
| ColorFunction | "Rainbow" | ways to color vertices |
Visualize the VertexSizeScaledGraph of the Golomb graph:
| In[1]:= |
| Out[1]= | 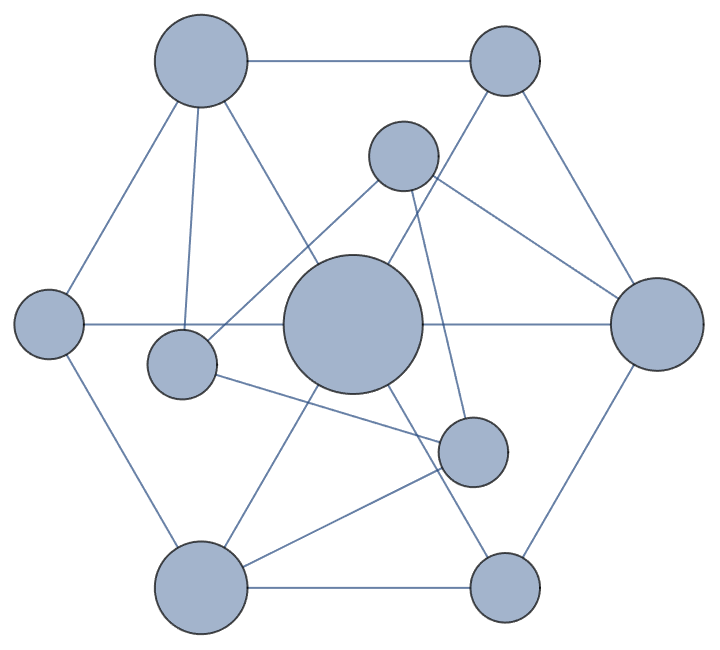 |
Limit the maximum vertex size with various graphs:
| In[2]:= |
| Out[2]= |  |
Visualize VertexSizeScaledGraph of a RandomGraph:
| In[3]:= | ![n = 50;
m = 6*n;
ResourceFunction["VertexSizeScaledGraph"][RandomGraph[{n, m}]]](https://www.wolframcloud.com/obj/resourcesystem/images/82d/82dfde6e-106f-4322-a329-1216e9f28362/2bf4eb236832eb4e.png) |
| Out[5]= | 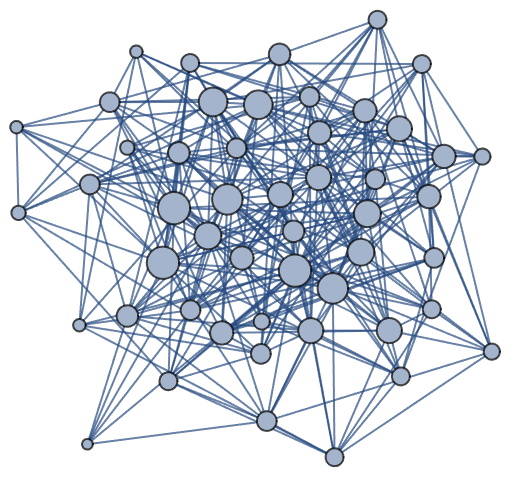 |
Also works on directed graphs:
| In[6]:= |
| Out[6]= | 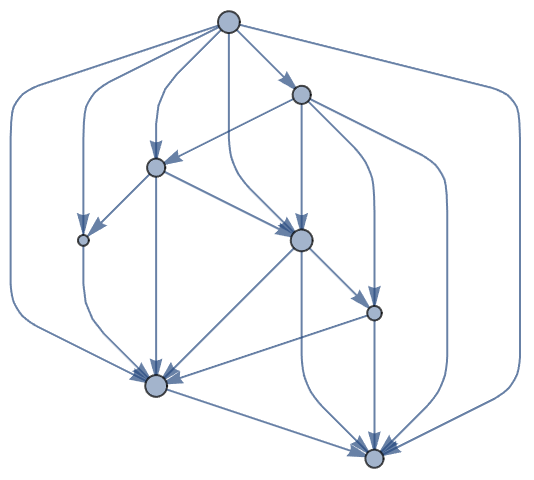 |
VertexSizeScaledGraph of SoiferGraph where the VertexSize is scaled by different measures:
| In[8]:= | ![Map[ResourceFunction["VertexSizeScaledGraph"][
GraphData["SoiferGraph"], "VertexSizeFunction" -> #] &, {(VertexDegree[#] &), (BetweennessCentrality[#] &), (LocalClusteringCoefficient[#] &), (EigenvectorCentrality[#] &)}]](https://www.wolframcloud.com/obj/resourcesystem/images/82d/82dfde6e-106f-4322-a329-1216e9f28362/3ce596303a48ea1a.png) |
| Out[8]= |  |
VertexSizeScaledGraph of the Actinobacillus Actinomycetemcomitans Metabolic Network scaled in two different ways:
| In[9]:= | ![ResourceFunction["VertexSizeScaledGraph"][
ResourceData[
"Actinobacillus Actinomycetemcomitans Metabolic Network"], "VertexSizeScalingFunction" -> (Log2[#] &), "MaxVertexSize" -> 30, VertexStyle -> RGBColor[0.91, 0.68, 0], EdgeStyle -> RGBColor[0, 0.58, 0.61]]](https://www.wolframcloud.com/obj/resourcesystem/images/82d/82dfde6e-106f-4322-a329-1216e9f28362/4f178440df324628.png) |
| Out[9]= | 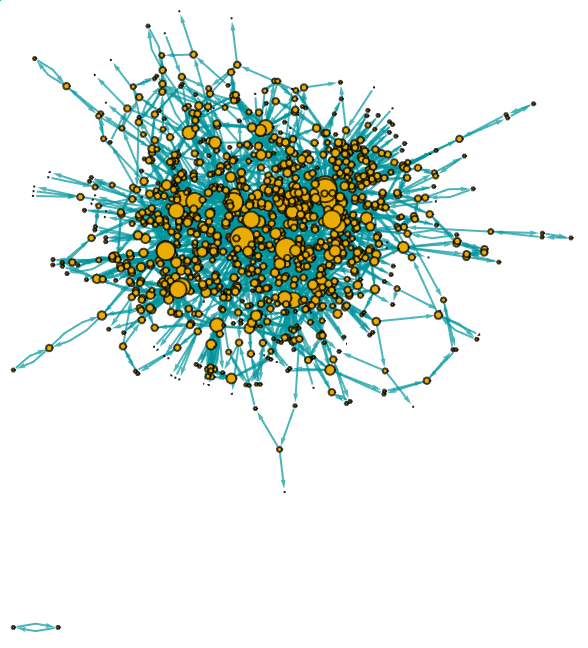 |
| In[10]:= | ![ResourceFunction["VertexSizeScaledGraph"][
ResourceData[
"Actinobacillus Actinomycetemcomitans Metabolic Network"], "VertexSizeScalingFunction" -> (#^0.5 &), "MaxVertexSize" -> 40, VertexStyle -> RGBColor[0.91, 0.68, 0], EdgeStyle -> RGBColor[0, 0.58, 0.61]]](https://www.wolframcloud.com/obj/resourcesystem/images/82d/82dfde6e-106f-4322-a329-1216e9f28362/560e93a9a4273b9e.png) |
| Out[10]= | 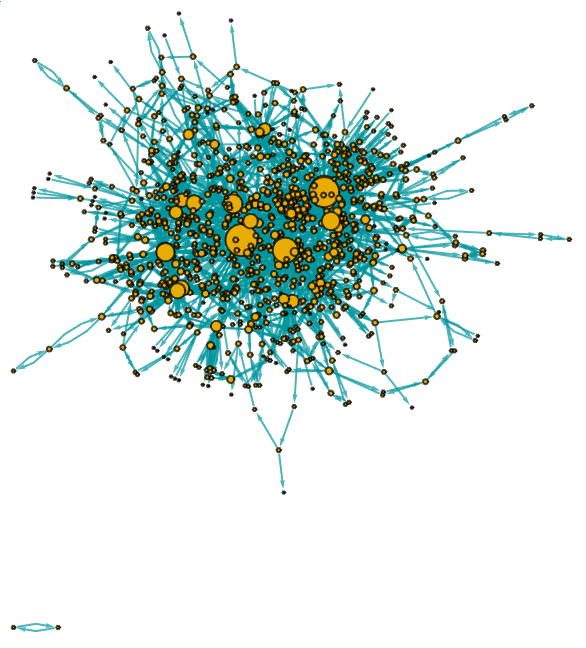 |
VertexSizeScaledGraph of the GolombGraph with vertices colored by different measures:
| In[11]:= | ![Map[ResourceFunction["VertexSizeScaledGraph"][
GraphData["GolombGraph"], "VertexColoringFunction" -> #] &, {(VertexDegree[#] &), (BetweennessCentrality[#] &), (LocalClusteringCoefficient[#] &), (ClosenessCentrality[#1] &)}]](https://www.wolframcloud.com/obj/resourcesystem/images/82d/82dfde6e-106f-4322-a329-1216e9f28362/51ade702107c50af.png) |
| Out[11]= |  |
VertexSizeScaledGraph of the GolombGraph with vertices colored by different measures and custom ColorFunction:
| In[12]:= | ![Map[ResourceFunction["VertexSizeScaledGraph"][
GraphData["GolombGraph"], "VertexColoringFunction" -> #, ColorFunction -> "DeepSeaColors"] &, {(VertexDegree[#] &), (BetweennessCentrality[#] &), (LocalClusteringCoefficient[#] &), (ClosenessCentrality[#1] &)}]](https://www.wolframcloud.com/obj/resourcesystem/images/82d/82dfde6e-106f-4322-a329-1216e9f28362/07ea2003914fb018.png) |
| Out[12]= |  |
| In[13]:= | ![bc = BetweennessCentrality[GraphData["GolombGraph"]];
cF = (Blend[{{Min@bc, RGBColor[0, 0, 1]}, {Mean[{Min@bc, Max@bc}], GrayLevel[1]}, {Max@bc, RGBColor[1, 0, 0]}}, #] &);
ResourceFunction["VertexSizeScaledGraph"][GraphData["GolombGraph"], "VertexColoringFunction" -> (BetweennessCentrality[#] &), ColorFunction -> cF]](https://www.wolframcloud.com/obj/resourcesystem/images/82d/82dfde6e-106f-4322-a329-1216e9f28362/363ef4ea490dc42d.png) |
| Out[14]= | 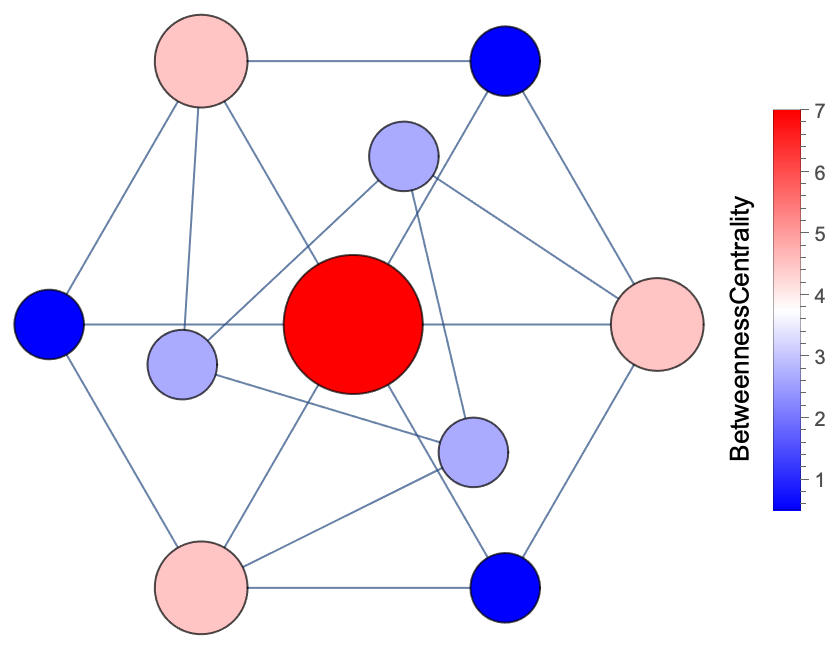 |
VertexSizeScaledGraph of a Disease Gene Network:
| In[15]:= | ![ResourceFunction["VertexSizeScaledGraph"][
ResourceData["Disease Gene Network"], VertexStyle -> RGBColor[0.6, 0.68, 0], EdgeStyle -> RGBColor[0, 0, 0.61], "MaxVertexSize" -> 100]](https://www.wolframcloud.com/obj/resourcesystem/images/82d/82dfde6e-106f-4322-a329-1216e9f28362/57adffae0a952b0a.png) |
| Out[15]= | 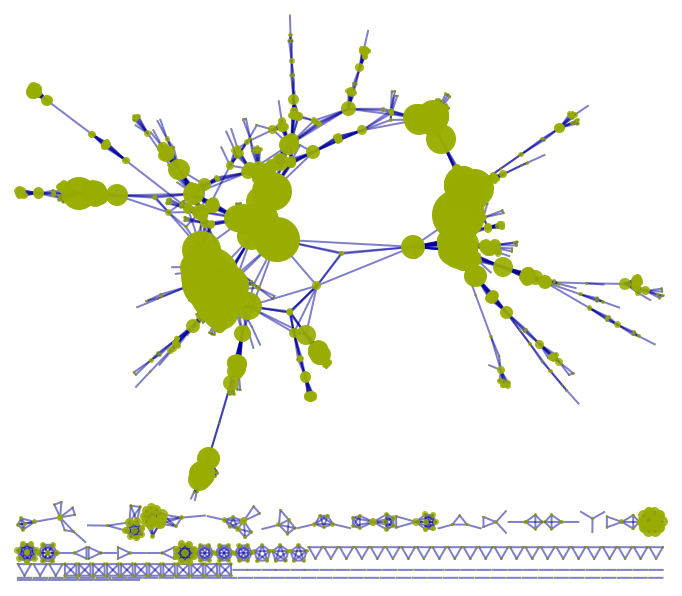 |
VertexSizeScaledGraph of a Disease Gene Network where the vertices are color-coded by its BetweennessCentrality:
| In[16]:= | ![ResourceFunction["VertexSizeScaledGraph"][
ResourceData["Disease Gene Network"], EdgeStyle -> RGBColor[0, 0, 0.61], "VertexColoringFunction" -> (BetweennessCentrality[#] &), ColorFunction -> "DeepSeaColors", "MaxVertexSize" -> 100]](https://www.wolframcloud.com/obj/resourcesystem/images/82d/82dfde6e-106f-4322-a329-1216e9f28362/729459228c729812.png) |
| Out[16]= | 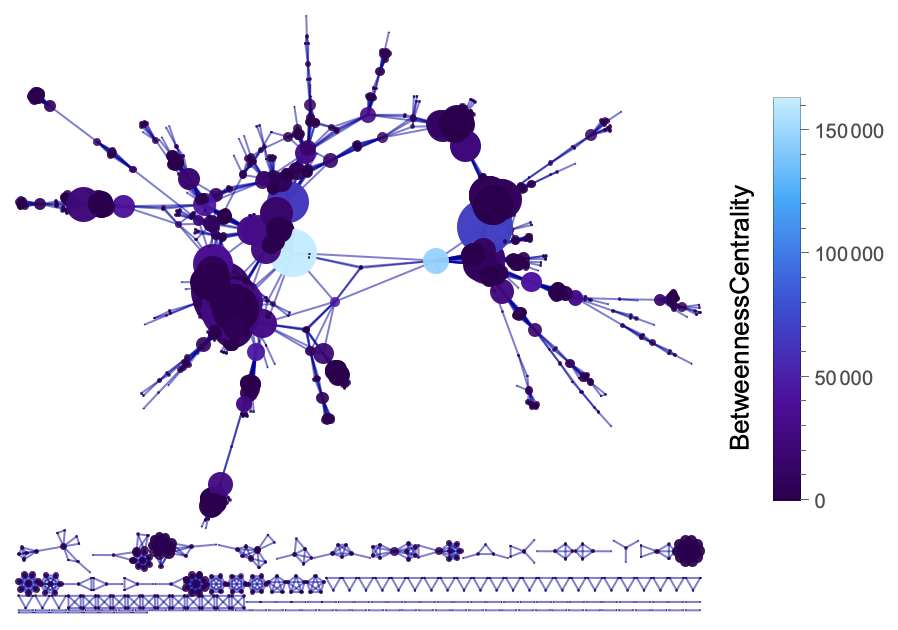 |
VertexSizeScaledGraph containing randomly chosen genes from the co-expression network in human tissues:
| In[17]:= | ![(* Evaluate this cell to get the example input *) CloudGet["https://www.wolframcloud.com/obj/a7579900-7048-4959-b348-af1a7d5cfa81"]](https://www.wolframcloud.com/obj/resourcesystem/images/82d/82dfde6e-106f-4322-a329-1216e9f28362/739326ff0f3155d6.png) |
| Out[11]= | 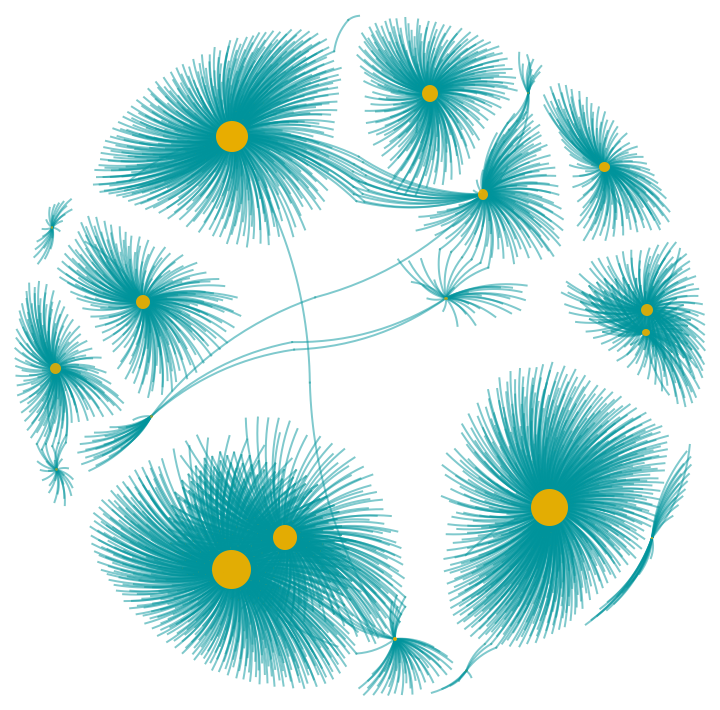 |
Wolfram Language 13.0 (December 2021) or above
This work is licensed under a Creative Commons Attribution 4.0 International License