Wolfram Function Repository
Instant-use add-on functions for the Wolfram Language
Function Repository Resource:
Visualize the intersections of overlapping sets
ResourceFunction["VennGraphPlot"][{set1, set2, …}] plots a graph showing the number of shared elements among the sets. |
| "Colors" | Automatic | colors to use for the primary sets |
| GraphLayout | Automatic | the embedding used in laying out the graph |
| "Labels" | Automatic | labels to use for the sets |
| "Orders" | All | display the n–way intersections in the graph |
| "TooltipSamples" | 10 | the number of samples from each set to display in the tooltip |
| "TooltipRandomize" | True | whether to show random samples in tooltip |
Visualize the intersections of three sets:
| In[1]:= |
| In[2]:= |
| Out[2]= | 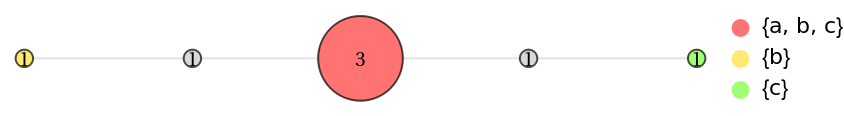 |
Visualize the pairwise intersections of sets:
| In[3]:= |
| Out[3]= |
| In[4]:= |
| Out[4]= | 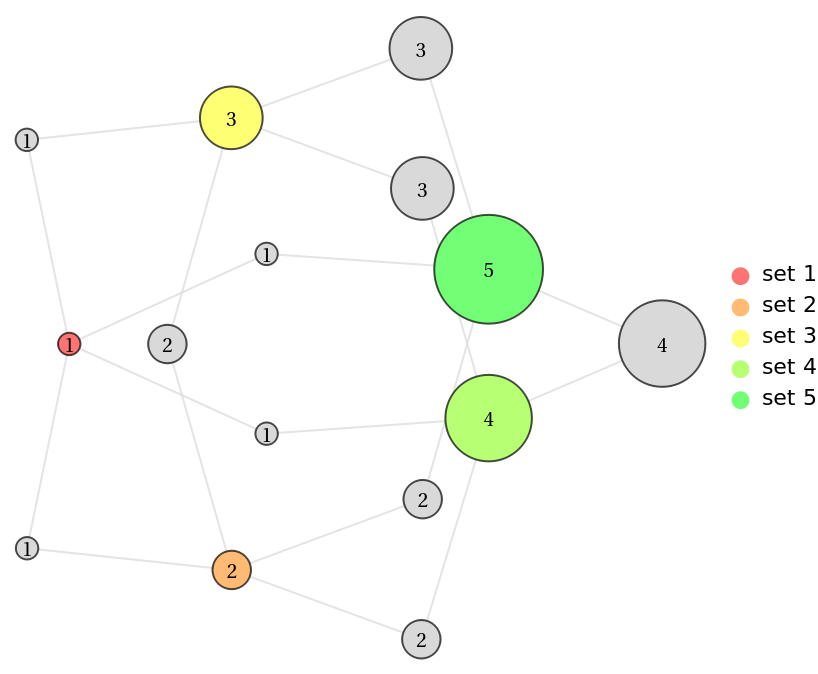 |
Plot a Venn graph with different intersection orders:
| In[5]:= |
| Out[6]= | 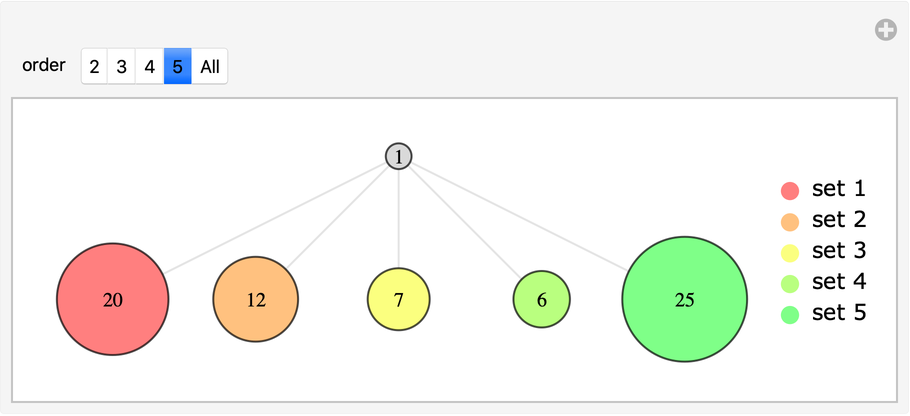 |
You can change the colors used for the sets node with the "Colors" option:
| In[7]:= |
| Out[7]= | 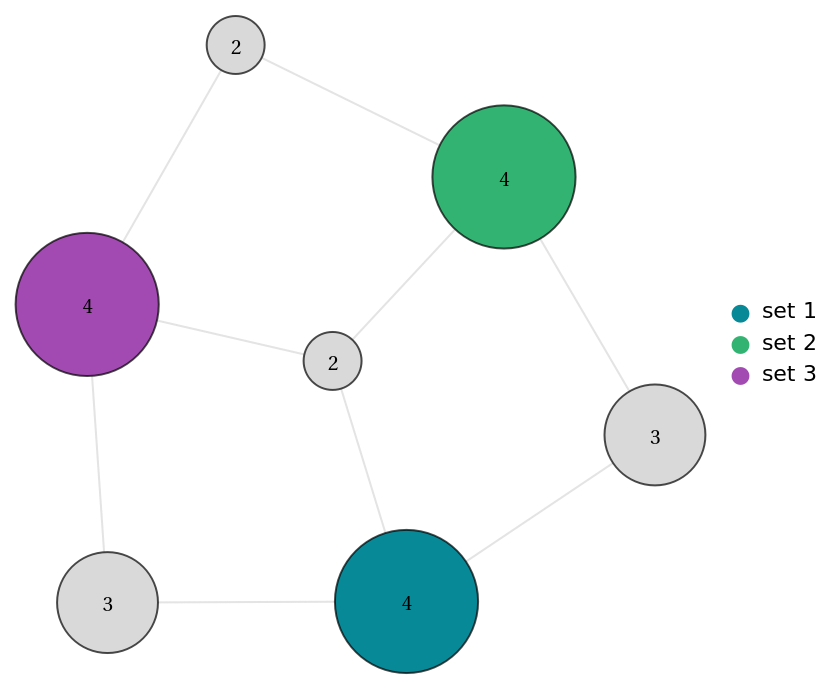 |
You can change the layout used with the GraphLayout option:
| In[8]:= |
| Out[8]= | 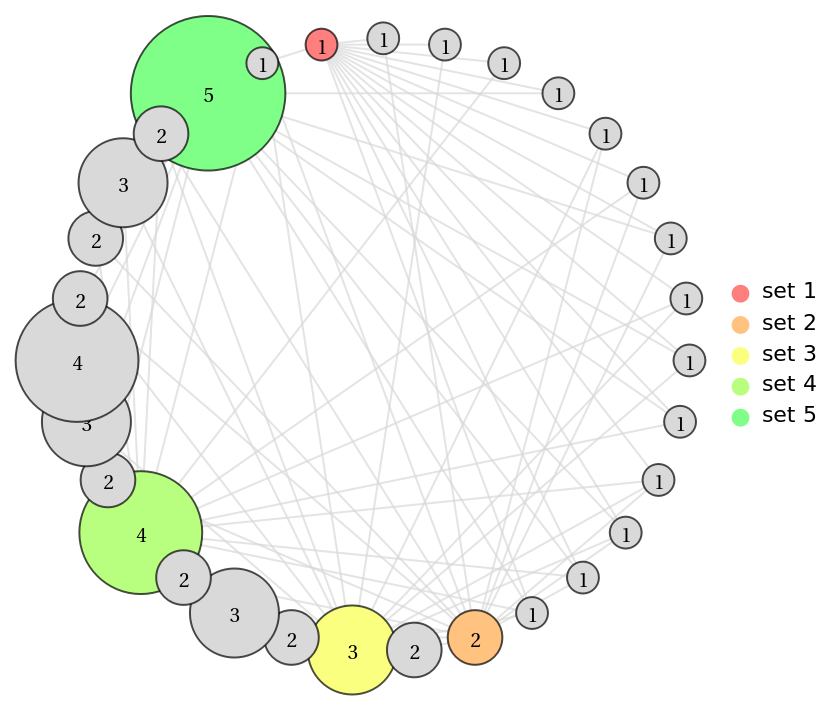 |
Show the size of the shared memberships between four political blocs:
| In[9]:= | ![cd = CountryData /@ {"FormerBritishColonies", "GroupOf8", "GroupOf15",
"InternationalCriminalCourt"};
ResourceFunction["VennGraphPlot"][cd, "Labels" -> {"Colonies", "G8", "G15", "ICC"}]](https://www.wolframcloud.com/obj/resourcesystem/images/ca3/ca349039-6552-4d66-9671-2f583615b168/4d0a1528a1aeaa7c.png) |
| Out[10]= | 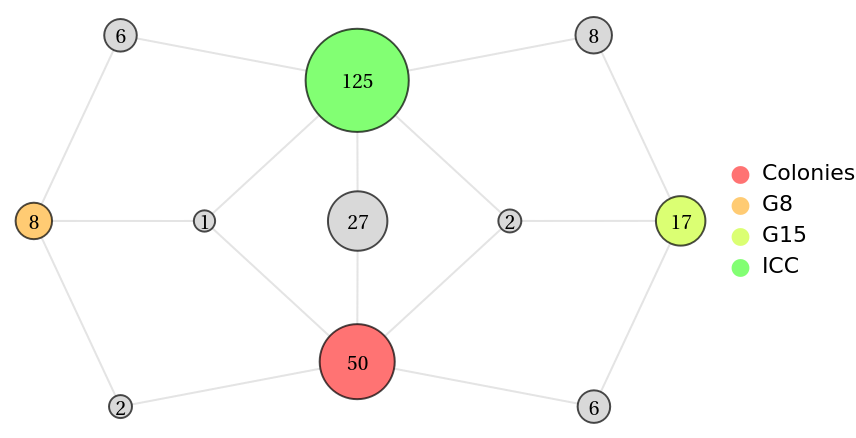 |
There is no lattice for totally independent sets :
| In[11]:= |
| Out[11]= |  |
The number of intersections can increase exponentially:
| In[12]:= |
| Out[12]= | 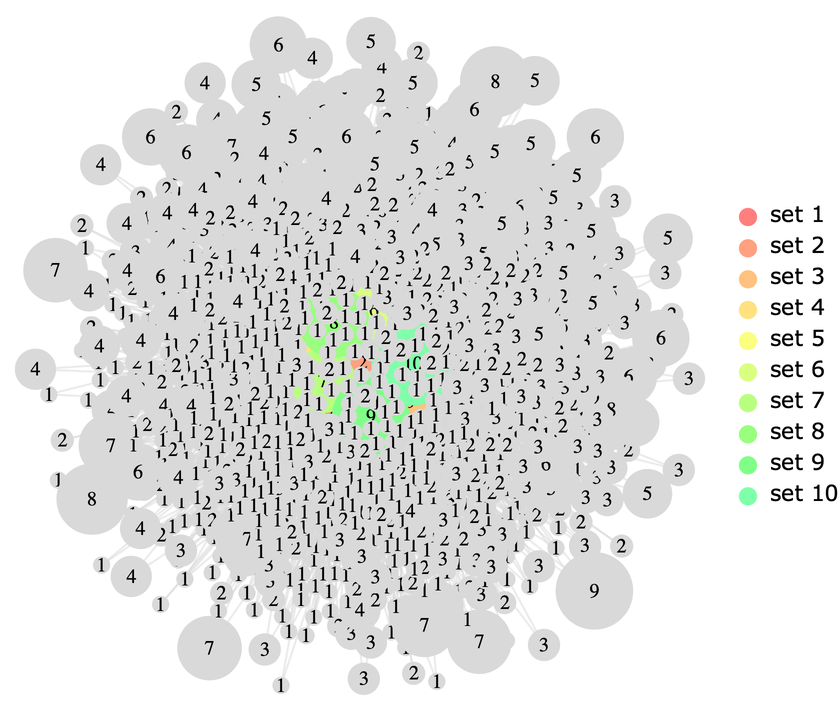 |
This work is licensed under a Creative Commons Attribution 4.0 International License