Wolfram Function Repository
Instant-use add-on functions for the Wolfram Language
Function Repository Resource:
Import Vaccine Adverse Event Reporting System data
ResourceFunction["VAERSData"][dir] imports Vaccine Adverse Event Reporting System data from the directory dir. | |
ResourceFunction["VAERSData"][zip] imports Vaccine Adverse Event Reporting System data from a ZIP file. | |
ResourceFunction["VAERSData"][{zip,dir}] exports zip to the specified directory before importing. | |
ResourceFunction["VAERSData"][…,elem] imports the specified element elem. | |
ResourceFunction["VAERSData"][…,id] returns all data associated with VAERS ID id. | |
ResourceFunction["VAERSData"][…,{id,elem}] returns elem data for VAERS ID id. | |
ResourceFunction["VAERSData"][data,spec] extracts the data specified by spec from the imported data. | |
ResourceFunction["VAERSData"][] opens the VAERS data download website to acquire new data. |
| "Reports" (default) | text descriptions of symptons along with dates, locations, ages and a VAERS ID number. |
| "Symptoms" | symptoms for each VAERS ID |
| "Vaccines" | information on vaccinations |
| "IDEventSeries" | an EventSeries containing "VAERS_ID" values for each date |
| "Merged" | a single Dataset containing combined report, vaccine and symptom data |
| id | a VAERS ID |
| {id,elem} | a VAERS ID and one of the elements listed above |
| {{id1,id2,…}} | combined data for several VAERS IDs |
| <|prop→val|> | an Association of vaccine properties |
Open the VAERS website to download the latest data:
| In[1]:= |
Import data from the downloaded ZIP file (this takes a few minutes the first time but is faster thereafter):
| In[2]:= |
| Out[2]= |
See a random sample of the data:
| In[3]:= |
| Out[3]= | 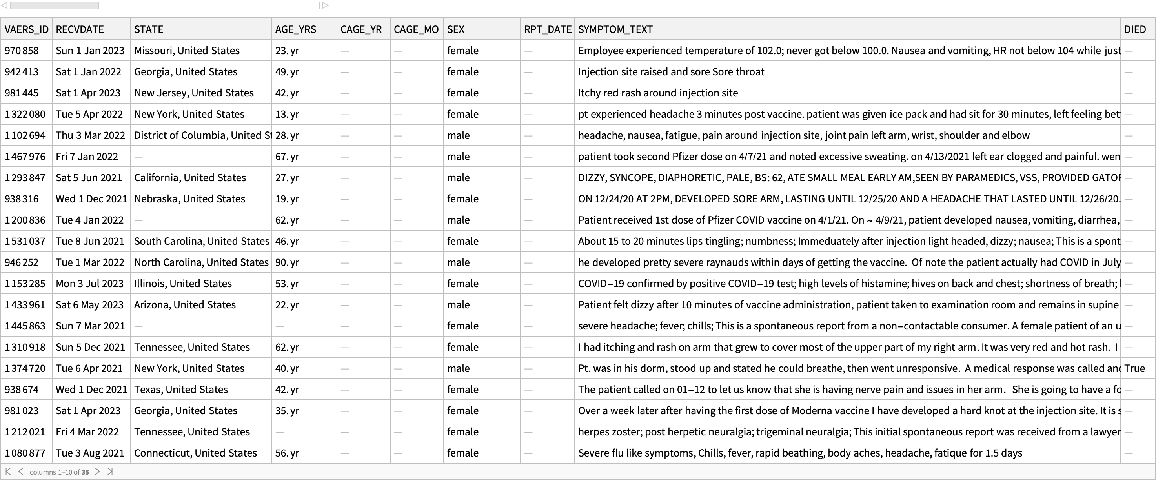 |
Find reactions to the Pfizer COVID-19 vaccine:
| In[4]:= |
| Out[4]= | 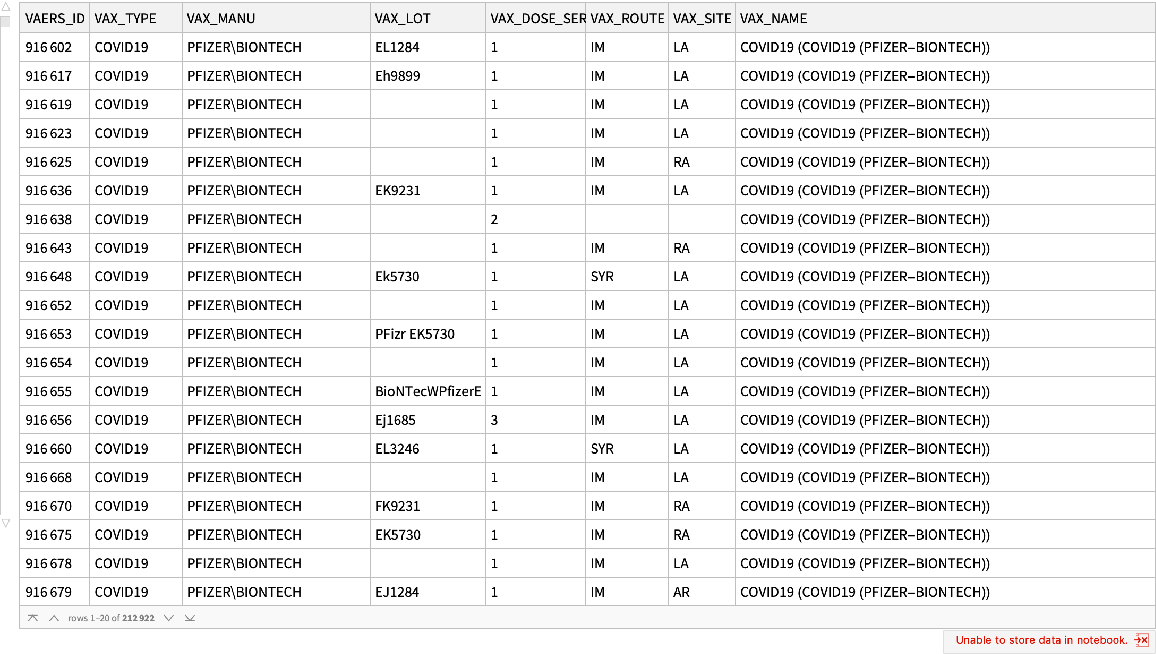 |
Import symptom data:
| In[5]:= | ![AbsoluteTiming[
sympdata = ResourceFunction["VAERSData"][
"/your path/to/download/2021VAERSData.zip", "Symptoms"];]](https://www.wolframcloud.com/obj/resourcesystem/images/576/5769e409-67c0-478f-a63e-5ce2cf775eb1/30c100644e1deef8.png) |
| Out[5]= |
See how long the data is:
| In[6]:= |
| Out[6]= |
See the columns in the data:
| In[7]:= |
| Out[7]= |
Find the most common symptoms:
| In[8]:= | ![TakeLargest[
Counts[Flatten@
Normal@Values@
sympdata[
All, {"SYMPTOM1", "SYMPTOM2", "SYMPTOM3", "SYMPTOM4", "SYMPTOM5"}]], 20]](https://www.wolframcloud.com/obj/resourcesystem/images/576/5769e409-67c0-478f-a63e-5ce2cf775eb1/34e32299cf1bdf02.png) |
| Out[8]= |  |
Get a TimeSeries of "VAERS_ID" values:
| In[9]:= |
| Out[9]= |  |
Find the number of events reported each day:
| In[10]:= |
| Out[10]= |
Plot the number of reported events over time along with a moving average:
| In[11]:= |
| Out[11]= | 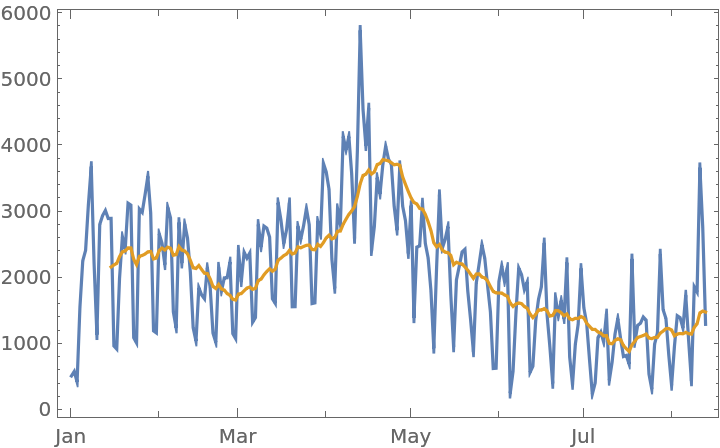 |
Import the vaccine data:
| In[12]:= | ![AbsoluteTiming[
vaxdata = ResourceFunction["VAERSData"][
"/your path/to/download/2021VAERSData.zip", "Vaccines"];]](https://www.wolframcloud.com/obj/resourcesystem/images/576/5769e409-67c0-478f-a63e-5ce2cf775eb1/3cff386258c24550.png) |
| Out[12]= |
See how long the data is:
| In[13]:= |
| Out[13]= |
See the columns in the data:
| In[14]:= |
| Out[14]= |
See the 10 most common vaccine types:
| In[15]:= |
| Out[15]= | 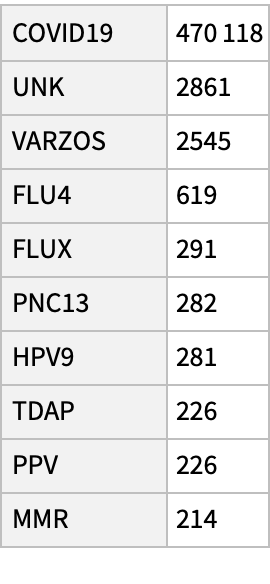 |
See the most common manufacturers:
| In[16]:= |
| Out[16]= | 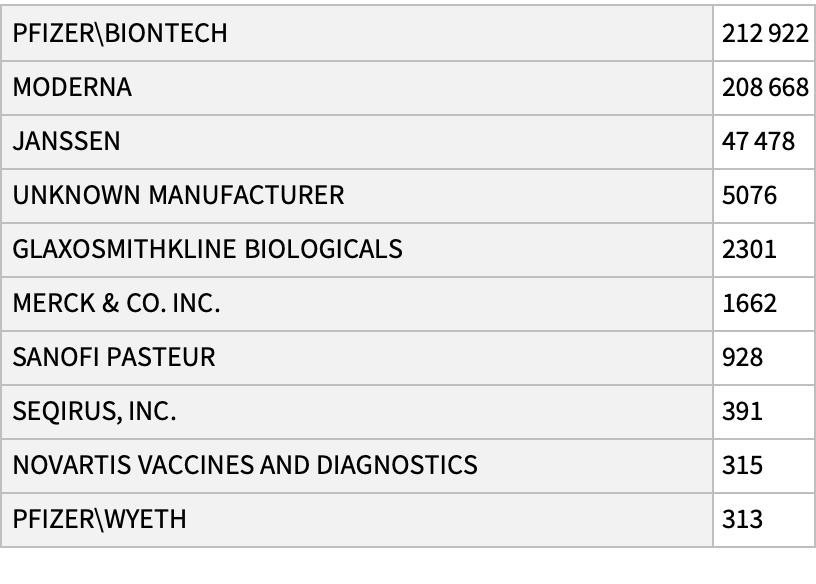 |
Import all the data:
| In[17]:= |
| Out[17]= |
See how big it is:
| In[18]:= |
| Out[18]= |
Find all the information about a specific VAERS ID by passing the data back to VAERSData:
| In[19]:= |
| Out[19]= |
See the vaccine associated with the VAERS ID:
| In[20]:= |
| Out[20]= | 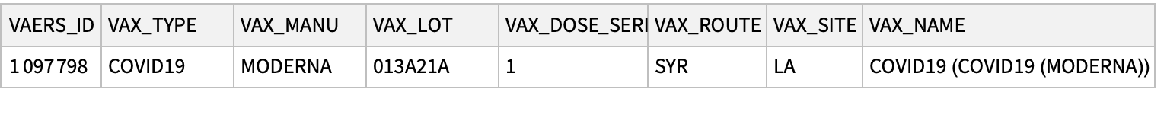 |
See the reports, while shortening long text:
| In[21]:= |
| Out[21]= |  |
See the symptoms:
| In[22]:= |
| Out[22]= | 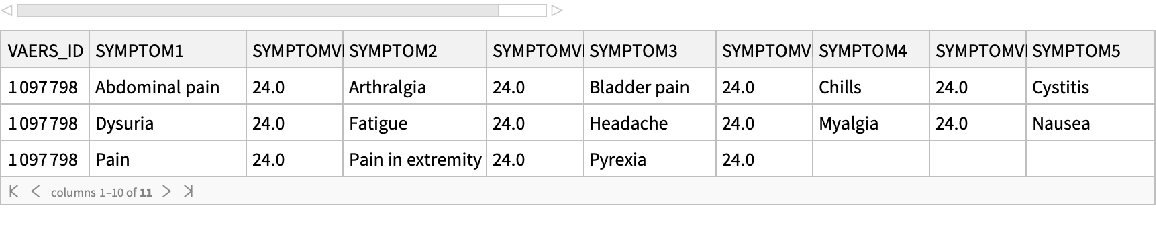 |
Get the symptoms directly:
| In[23]:= |
| Out[23]= |  |
Get all the data:
| In[24]:= |
| Out[24]= |
Get VAERS IDs for each manufacturer:
| In[25]:= | ![pfizerids = DeleteDuplicates@
Normal@ResourceFunction["VAERSData"][
alldata["Vaccines"], <|"VAX_TYPE" -> "COVID19", "VAX_MANU" -> "PFIZER\\BIONTECH"|>][All, "VAERS_ID"]](https://www.wolframcloud.com/obj/resourcesystem/images/576/5769e409-67c0-478f-a63e-5ce2cf775eb1/5f6474424a6bbb9a.png) |
| Out[25]= | 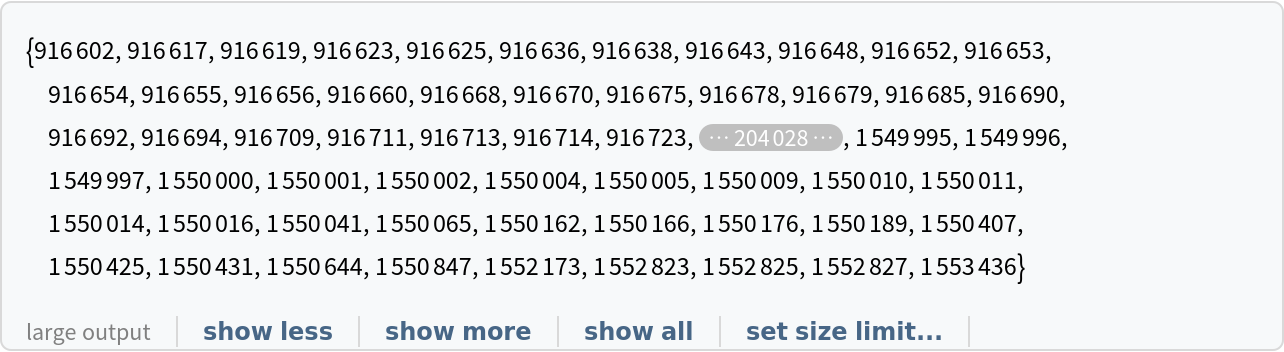 |
| In[26]:= | ![modernaids = DeleteDuplicates@
Normal@ResourceFunction["VAERSData"][
alldata["Vaccines"], <|"VAX_TYPE" -> "COVID19", "VAX_MANU" -> "MODERNA"|>][All, "VAERS_ID"]](https://www.wolframcloud.com/obj/resourcesystem/images/576/5769e409-67c0-478f-a63e-5ce2cf775eb1/210055013dd4dfb2.png) |
| Out[26]= | 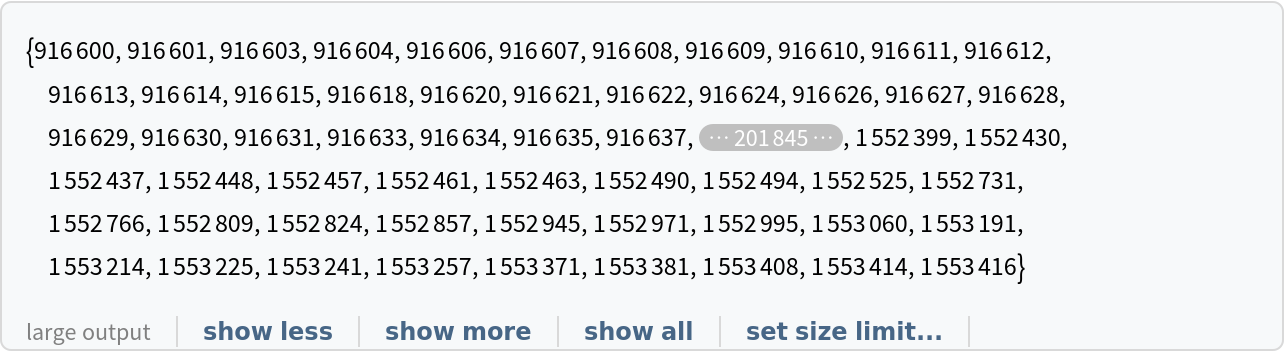 |
| In[27]:= | ![jnjids = DeleteDuplicates@
Normal@ResourceFunction["VAERSData"][
alldata["Vaccines"], <|"VAX_TYPE" -> "COVID19", "VAX_MANU" -> "JANSSEN"|>][All, "VAERS_ID"]](https://www.wolframcloud.com/obj/resourcesystem/images/576/5769e409-67c0-478f-a63e-5ce2cf775eb1/30cb9be4e1f61814.png) |
| Out[27]= | 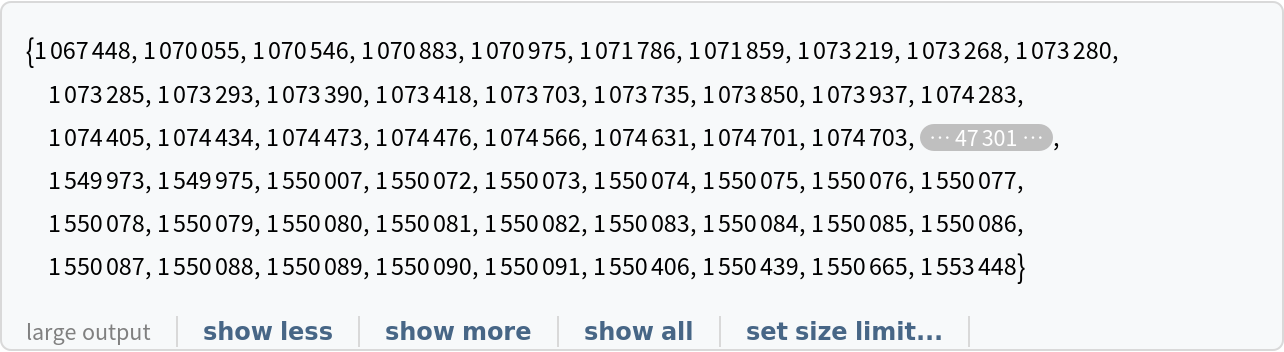 |
Find the all the reported symptoms for each manufacturer. This is slow:
| In[28]:= |
| Out[28]= |
| In[29]:= |
| Out[29]= |
| In[30]:= |
| Out[30]= |
Count the number of reports of each symptom for each manufacturer:
| In[31]:= | ![pfizercounts = ResourceFunction["Proportions"]@
DeleteCases[
Flatten@Normal@
Values@pfizersymptoms[
All, {"SYMPTOM1", "SYMPTOM2", "SYMPTOM3", "SYMPTOM4", "SYMPTOM5"}], ""];](https://www.wolframcloud.com/obj/resourcesystem/images/576/5769e409-67c0-478f-a63e-5ce2cf775eb1/0f2df6119590a36c.png) |
| In[32]:= | ![modernacounts = ResourceFunction["Proportions"]@
DeleteCases[
Flatten@Normal@
Values@modernasymptoms[
All, {"SYMPTOM1", "SYMPTOM2", "SYMPTOM3", "SYMPTOM4", "SYMPTOM5"}], ""];](https://www.wolframcloud.com/obj/resourcesystem/images/576/5769e409-67c0-478f-a63e-5ce2cf775eb1/45e6bc433ba7b709.png) |
| In[33]:= | ![jnjcounts = ResourceFunction["Proportions"]@
DeleteCases[
Flatten@Normal@
Values@jnjsymptoms[
All, {"SYMPTOM1", "SYMPTOM2", "SYMPTOM3", "SYMPTOM4", "SYMPTOM5"}], ""];](https://www.wolframcloud.com/obj/resourcesystem/images/576/5769e409-67c0-478f-a63e-5ce2cf775eb1/346a08233d2bf860.png) |
Plot the most common symptoms for each manufacturer as a BarChart:
| In[34]:= |
| Out[34]= |  |
| In[35]:= | ![BarChart[Transpose[
Lookup[k] /@ {pfizercounts, modernacounts, jnjcounts}], ChartLabels -> {Placed[k, Axis, Rotate[#, Pi/2] &], None}, ChartLegends -> {"Pfizer", "Moderna", "JohnsonAndJohnson"}]](https://www.wolframcloud.com/obj/resourcesystem/images/576/5769e409-67c0-478f-a63e-5ce2cf775eb1/4f6b8674f5073e8f.png) |
| Out[35]= | 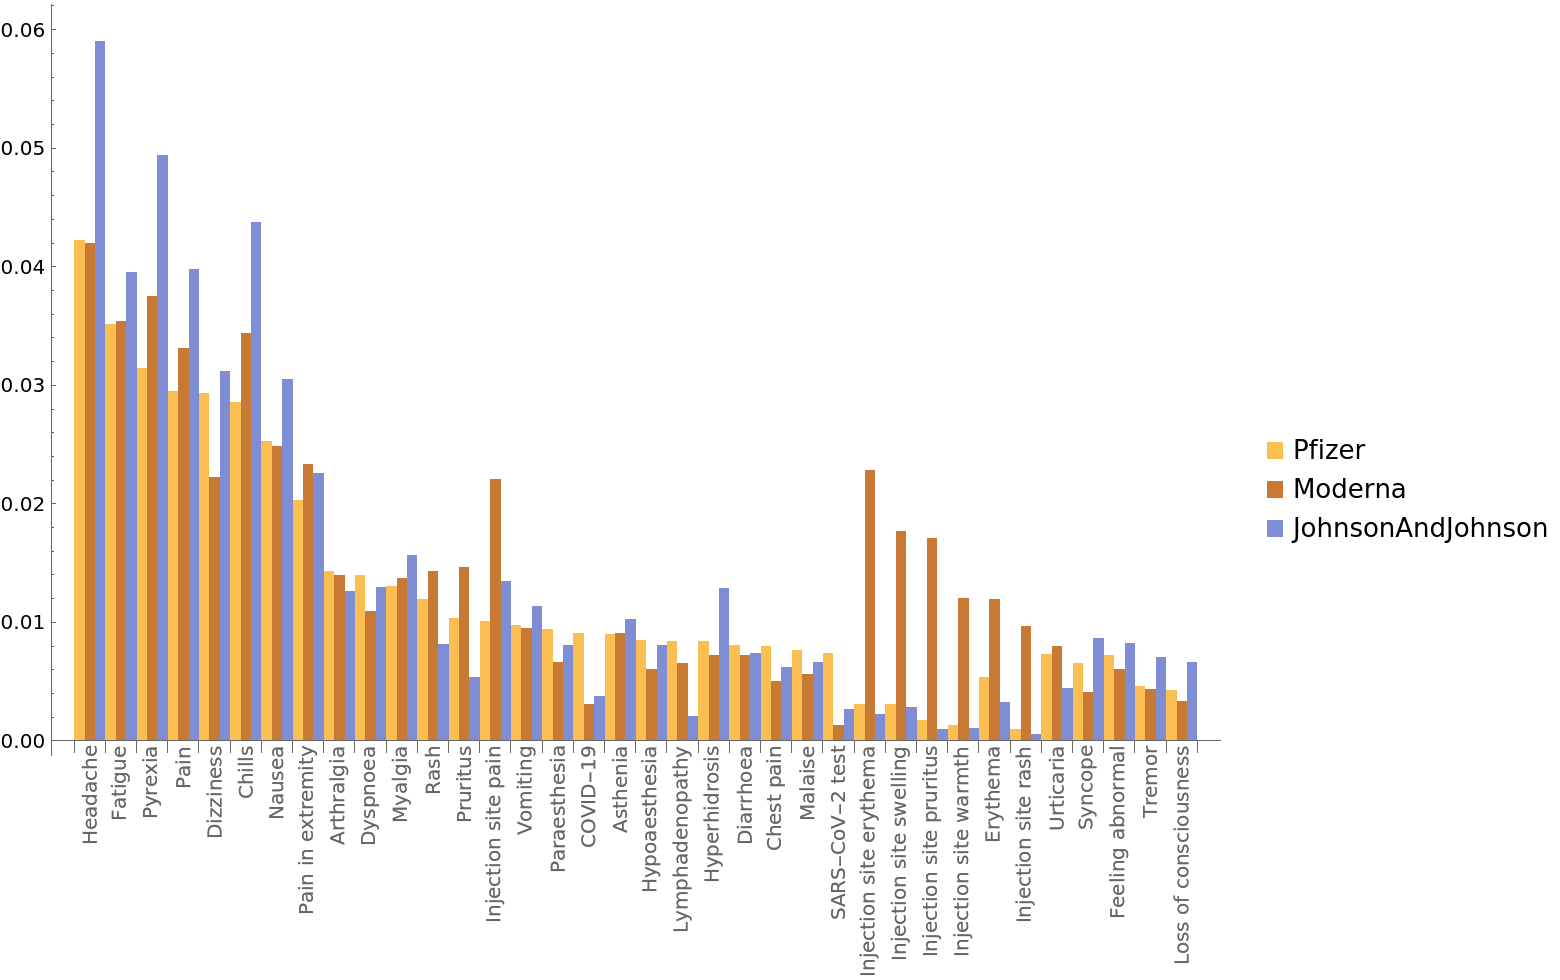 |
Retrieve the datasets:
| In[36]:= |
| Out[36]= |
Find reports for patients between four and eight years old:
| In[37]:= |
| In[38]:= |
| Out[38]= |
Retrieve vaccine information for those patients:
| In[39]:= | ![AbsoluteTiming[
kidscovid = kids[Select[
Function[k, SelectFirst[
alldata["Vaccines"], #["VAERS_ID"] === k["VAERS_ID"] &][
"VAX_TYPE"] === "COVID19"]]];]](https://www.wolframcloud.com/obj/resourcesystem/images/576/5769e409-67c0-478f-a63e-5ce2cf775eb1/012b4c93545ef75c.png) |
| Out[39]= |
| In[40]:= |
| Out[40]= |
See the resulting data:
| In[41]:= |
| Out[41]= | 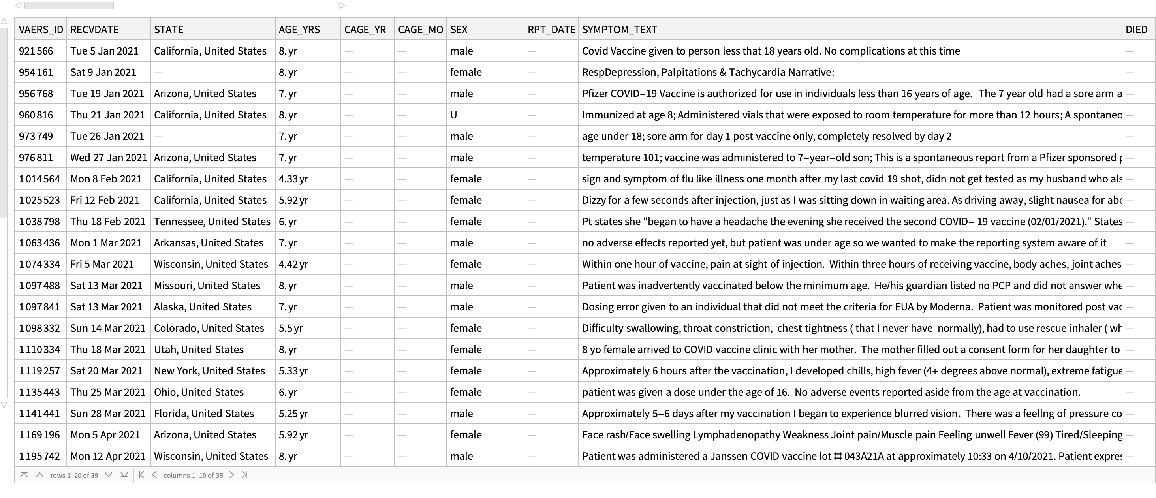 |
Get a TimeSeries of all "VAERS_ID" values:
| In[42]:= |
| Out[42]= |  |
Import the full dataset for searching:
| In[43]:= |
| Out[43]= |
Get the VAERS IDs for Pfizer COVID-19 vaccinations:
| In[44]:= | ![pfizerids = DeleteDuplicates@
Normal@ResourceFunction["VAERSData"][
alldata["Vaccines"], <|"VAX_TYPE" -> "COVID19", "VAX_MANU" -> "PFIZER\\BIONTECH"|>][All, "VAERS_ID"];](https://www.wolframcloud.com/obj/resourcesystem/images/576/5769e409-67c0-478f-a63e-5ce2cf775eb1/3775caedfaff1f56.png) |
Get the time series for those IDs:
| In[45]:= |
| Out[45]= |  |
Plot the number of Pfizer reports and total number of reports over time:
| In[46]:= |
| In[47]:= |
| In[48]:= |
| Out[48]= | 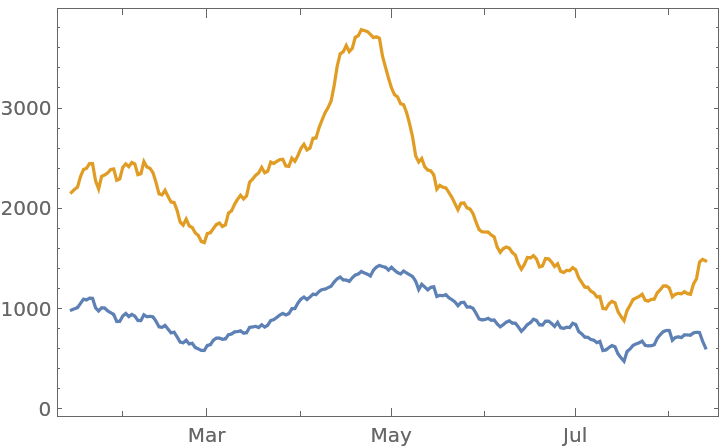 |
Define a function to find symptoms for events on a specific day for a specific vaccine:
| In[49]:= |
Find Johnson & Johnson symptoms on May 5:
| In[50]:= |
| Out[50]= |
| In[51]:= |
| Out[51]= |
Show the most common symptoms:
| In[52]:= | ![KeyDrop[TakeLargest[
Counts@Flatten@
Normal@Values@
jnjMay5[All, {"SYMPTOM1", "SYMPTOM2", "SYMPTOM3", "SYMPTOM4", "SYMPTOM5"}], 10], ""]](https://www.wolframcloud.com/obj/resourcesystem/images/576/5769e409-67c0-478f-a63e-5ce2cf775eb1/5a292594365a5f39.png) |
| Out[52]= |
Repeat this for the first day of each month:
| In[53]:= | ![AbsoluteTiming[
jnjFirstOfTheMonth = Table[vaccineDaySymptoms["JANSSEN", DateObject[{2021, month, 1}]], {month, 3, 8}];]](https://www.wolframcloud.com/obj/resourcesystem/images/576/5769e409-67c0-478f-a63e-5ce2cf775eb1/0e1558d5de7822b9.png) |
| Out[53]= |
Get the tallies:
| In[54]:= | ![jnjFirstOfTheMonthCounts = KeyDrop[Counts@
Flatten@Normal@
Values@#[
All, {"SYMPTOM1", "SYMPTOM2", "SYMPTOM3", "SYMPTOM4", "SYMPTOM5"}], ""] & /@ jnjFirstOfTheMonth;](https://www.wolframcloud.com/obj/resourcesystem/images/576/5769e409-67c0-478f-a63e-5ce2cf775eb1/100e6d5f558635dd.png) |
| In[55]:= | ![DateListPlot[{DateObject[{2021, #, 1}] & /@ Range[3, 8], Lookup["Headache"] /@ jnjFirstOfTheMonthCounts}\[Transpose], Joined -> False, Filling -> Axis, PlotLabel -> "Johnson and Johnson headaches reported on the 1st of each month"]](https://www.wolframcloud.com/obj/resourcesystem/images/576/5769e409-67c0-478f-a63e-5ce2cf775eb1/2f4c2e01c3f12590.png) |
| Out[55]= | 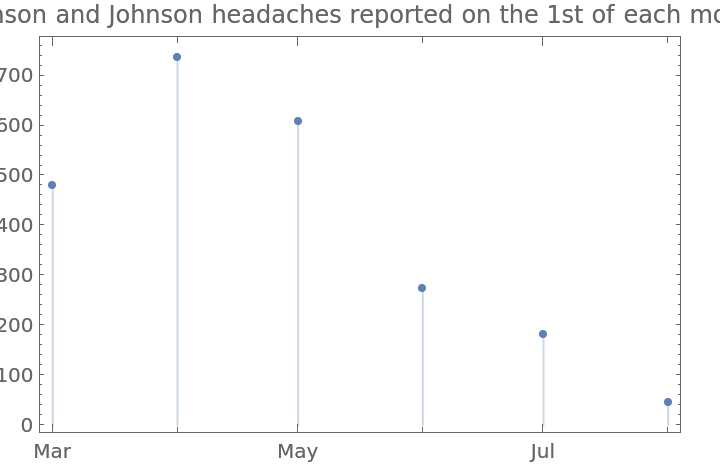 |
Compute the time needed to download the VAERS data:
| In[56]:= | ![AbsoluteTiming[
merged = ResourceFunction["VAERSData"][
"/your path/to/download/2021VAERSData.zip", "Merged"];]](https://www.wolframcloud.com/obj/resourcesystem/images/576/5769e409-67c0-478f-a63e-5ce2cf775eb1/26f52a858749afb2.png) |
| Out[56]= |
Save the combined data for future use:
| In[57]:= |
Work with the combined dataset. Query an age range:
| In[58]:= |
| In[59]:= |
| Out[59]= |
See a sample:
| In[60]:= |
| Out[60]= | 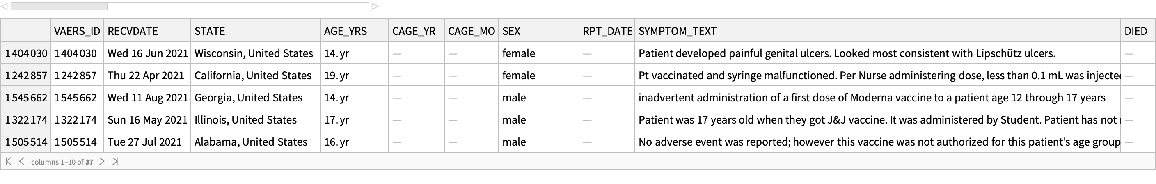 |
Within the age range, count reports by sex:
| In[61]:= |
| Out[61]= | 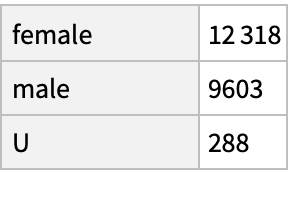 |
Within the age range, find non-COVID vaccine reports:
| In[62]:= |
| Out[62]= | 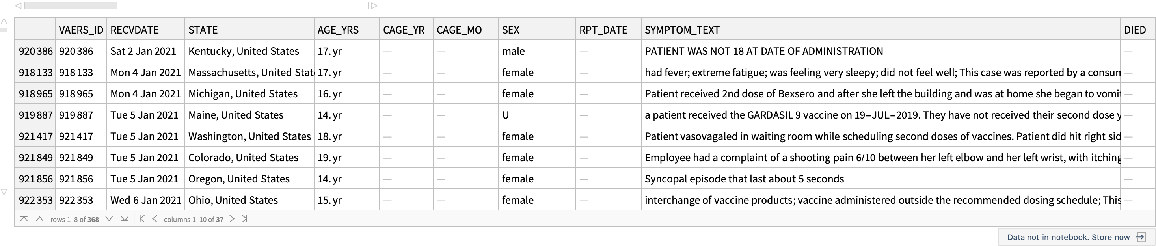 |
Find COVID-19 vaccination reports in the age range:
| In[63]:= |
| Out[63]= | 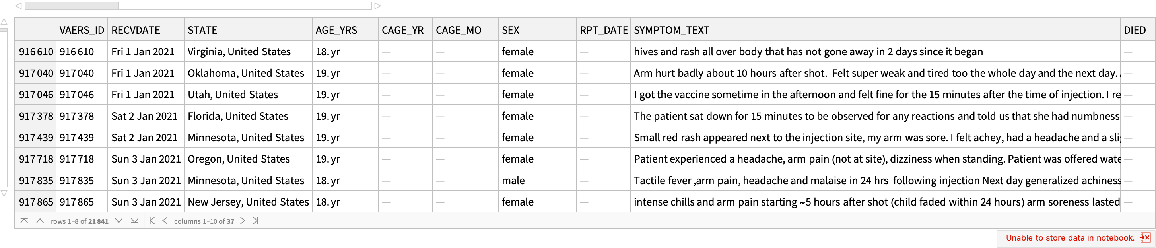 |
Show the number of reports over time as a histogram:
| In[64]:= |
| Out[64]= | 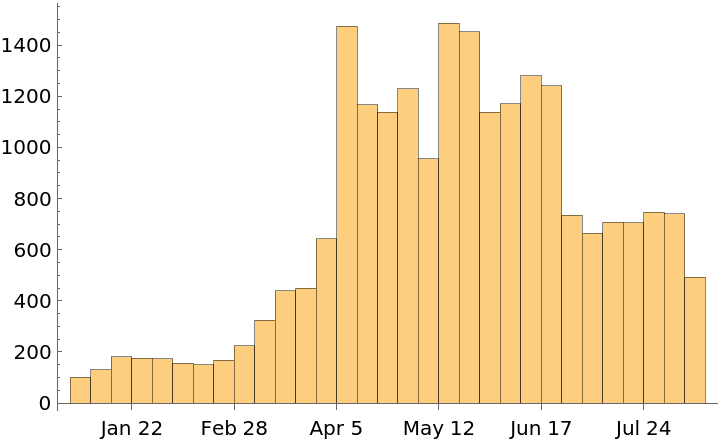 |
This work is licensed under a Creative Commons Attribution 4.0 International License