Wolfram Function Repository
Instant-use add-on functions for the Wolfram Language
Function Repository Resource:
Retrieve coal production data for regions in the United States
ResourceFunction["UnitedStatesCoalProduction"][region,key] gives a time series for coal production in region, using the API key from the U.S. Energy Information Administration. |
Coal production in the United States for 2001—2018:
| In[1]:= |
| Out[1]= |
Average coal production over the time series:
| In[2]:= |
| Out[2]= |
Minimum and maximum coal production over the time series:
| In[3]:= |
| Out[3]= |
Time series plot for the coal production:
| In[4]:= |
| Out[4]= | 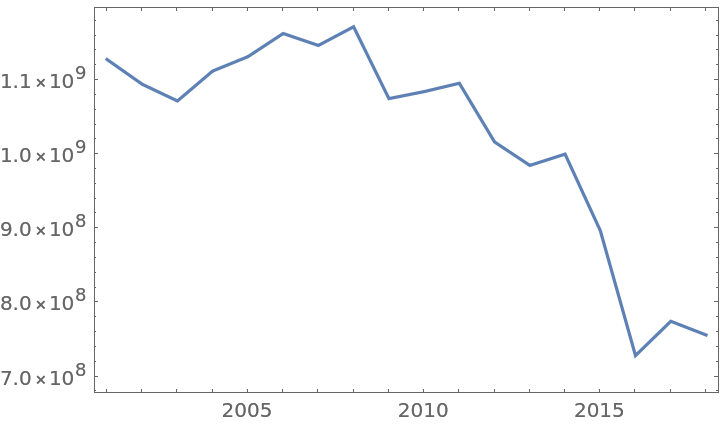 |
Coal production for the northern and southern Appalachian regions:
| In[5]:= | ![DateListPlot[
ResourceFunction["UnitedStatesCoalProduction"][#, key] & /@ {"APN", "APS"}, PlotLegends -> {"Northern Appalachia", "Southern Appalachia"}]](https://www.wolframcloud.com/obj/resourcesystem/images/733/733f1c6c-40a0-4237-a97a-a51d76ab9ae4/0f0939ff56515c5d.png) |
| Out[5]= | 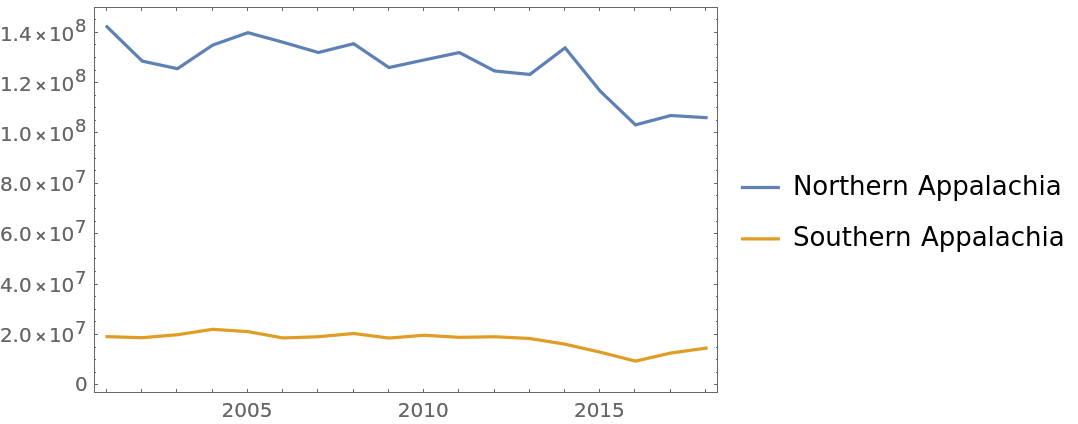 |
Coal production for Texas, Kentucky, and Illinois:
| In[6]:= | ![DateListPlot[
ResourceFunction["UnitedStatesCoalProduction"][#, key] & /@ {"TX", "KY", "IL"}, PlotLegends -> {"Texas", "Kentucky", "Illinois"}]](https://www.wolframcloud.com/obj/resourcesystem/images/733/733f1c6c-40a0-4237-a97a-a51d76ab9ae4/7cacaaa1e0eb6c6e.png) |
| Out[6]= | 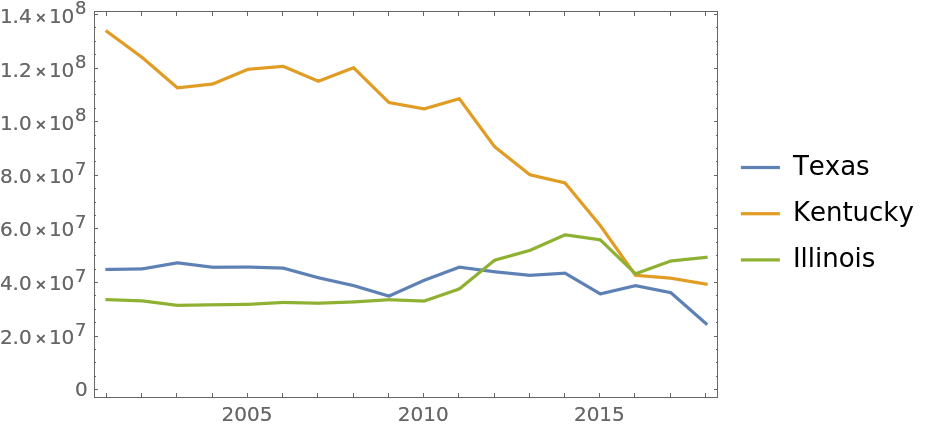 |
This work is licensed under a Creative Commons Attribution 4.0 International License