Wolfram Function Repository
Instant-use add-on functions for the Wolfram Language
Function Repository Resource:
Implementation of the Turbo color map
ResourceFunction["TurboColor"][q] interpolates the Turbo color scheme along the parameter q in a range from 0 to 1. Values above 1 and below zero get clamped. |
Evaluate the color map at a single point q=0.1 :
| In[1]:= |
|
| Out[1]= |
|
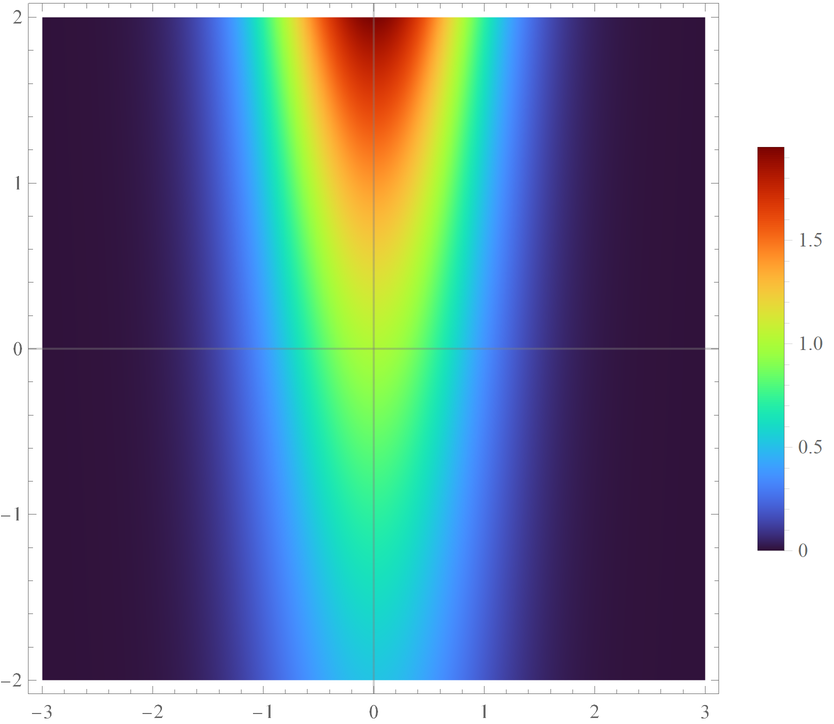
Use the color map as the ColorFunction for a DensityPlot:
| In[2]:= |
![DensityPlot[Exp[-x^2 + y/3], {x, -3, 3}, {y, -2, 2}, PlotRange -> All,
PlotPoints -> 100, PlotLegends -> Automatic,
ColorFunction -> (ResourceFunction["TurboColor"][#] &)]](https://www.wolframcloud.com/obj/resourcesystem/images/b83/b83359ec-0fdb-4444-860e-c0ea5b98e03e/7871a8c872dcb962.png)
|
| Out[2]= |

|
TurboColor automatically threads over lists:
| In[3]:= |
|
| Out[3]= |
|
Values below zero and above 1 get clamped:
| In[5]:= |
|
| Out[5]= |
|
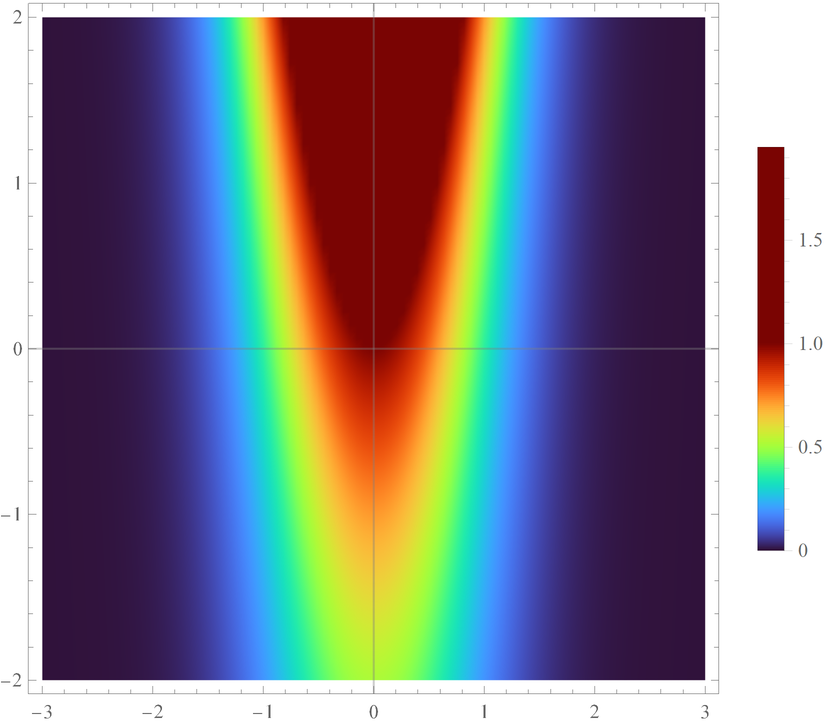
TurboColor clamps values and thus needs ColorFunctionScaling to be True to use the whole value range:
| In[6]:= |
![DensityPlot[Exp[-x^2 + y/3], {x, -3, 3}, {y, -2, 2}, PlotRange -> All,
PlotPoints -> 100, PlotLegends -> Automatic, ColorFunctionScaling -> False,
ColorFunction -> (ResourceFunction["TurboColor"][#] &)]](https://www.wolframcloud.com/obj/resourcesystem/images/b83/b83359ec-0fdb-4444-860e-c0ea5b98e03e/03c5958a74b0b6eb.png)
|
| Out[6]= |

|
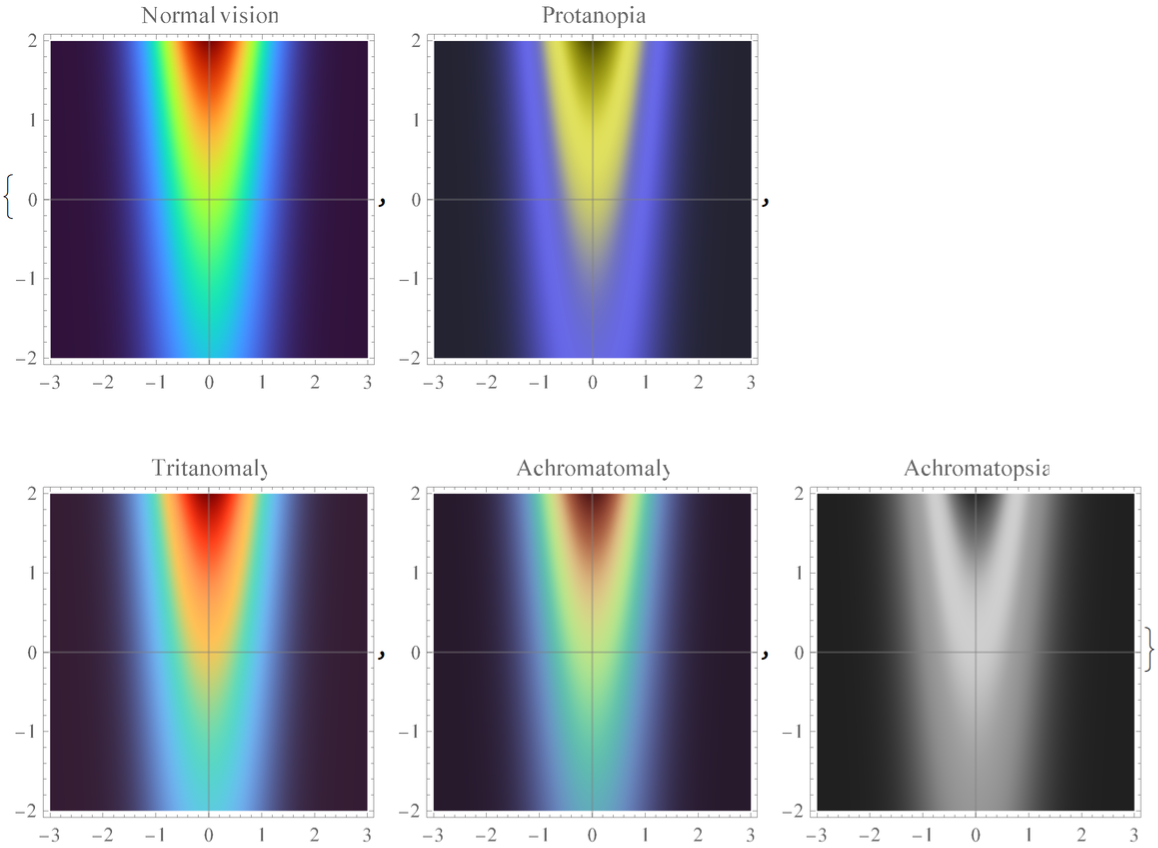
Rough simulation of the color map with normal vision, Protanopia, Tritanomaly, Achromatomaly and Achromatopsia color blindness:
| In[7]:= |
![DensityPlot[Exp[-x^2 + y/3], {x, -3, 3}, {y, -2, 2}, PlotRange -> All,
PlotPoints -> 100, PlotLabel -> #2,
ColorFunction -> Function[
q, (ResourceFunction["TurboColor"][q] /. RGBColor[r_, g_, b_] :> RGBColor[#1 . {r, g, b}])]] & @@@ {
{IdentityMatrix[3], "Normal vision"},
{{{0.57, 0.43, 0}, {0.56, 0.44, 0}, {0, 0.24, 0.76}}, "Protanopia"},
{{{0.97, 0.3, 0}, {0, 0.73, 0.27}, {0, 0.18, 0.82}}, "Tritanomaly"},
{{{0.62, 0.32, 0.06}, {0.16, 0.78, 0.06}, {0.16, 0.32, 0.52}}, "Achromatomaly"},
{ConstantArray[{0.3, 0.59, 0.11}, 3], "Achromatopsia"}
}](https://www.wolframcloud.com/obj/resourcesystem/images/b83/b83359ec-0fdb-4444-860e-c0ea5b98e03e/0ab7ac83f277b98c.png)
|
| Out[7]= |

|
This work is licensed under a Creative Commons Attribution 4.0 International License