Wolfram Function Repository
Instant-use add-on functions for the Wolfram Language
Function Repository Resource:
Create a contour plot for the rain totals of a given tropical storm
ResourceFunction["TropicalStormRainContourPlot"][basin,name,year] creates a contour plot of the rainfall for the given tropical storm. |
| All | all basins |
| "Australia" | basins surrounding Australia |
| "EastPacific" | East Pacific basin |
| "NorthAmerica" | basins surrounding North America |
| "NorthAtlantic" | North Atlantic basin |
| "NorthIndian" | North Indian basin |
| "SouthAtlantic" | South Atlantic basin |
| "SouthIndian" | South Indian basin |
| "SouthPacific" | South Pacific basin |
| "WestPacific" | West Pacific basin |
Make a contour plot for the rain totals for hurricane Katrina (2005):
| In[1]:= |
| Out[1]= | 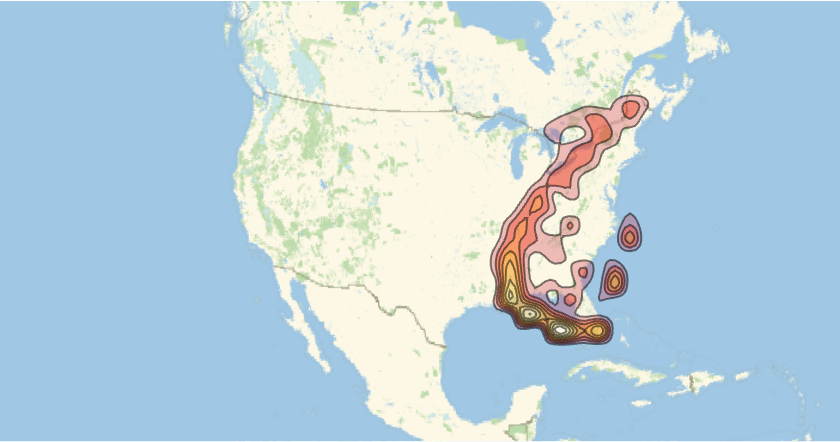 |
Make a contour plot for the rain totals for hurricane Michael (2018), with a satellite background and with a closer-up range:
| In[2]:= | ![ResourceFunction[
"TropicalStormRainContourPlot"]["NorthAtlantic", "Michael", 2018, GeoBackground -> "Satellite", GeoRange -> {{20, 50}, {-90, -60}}]](https://www.wolframcloud.com/obj/resourcesystem/images/9b8/9b8d2f21-0709-4eca-aa0c-9de6adbe5555/44a7de46fba9464e.png) |
| Out[2]= | 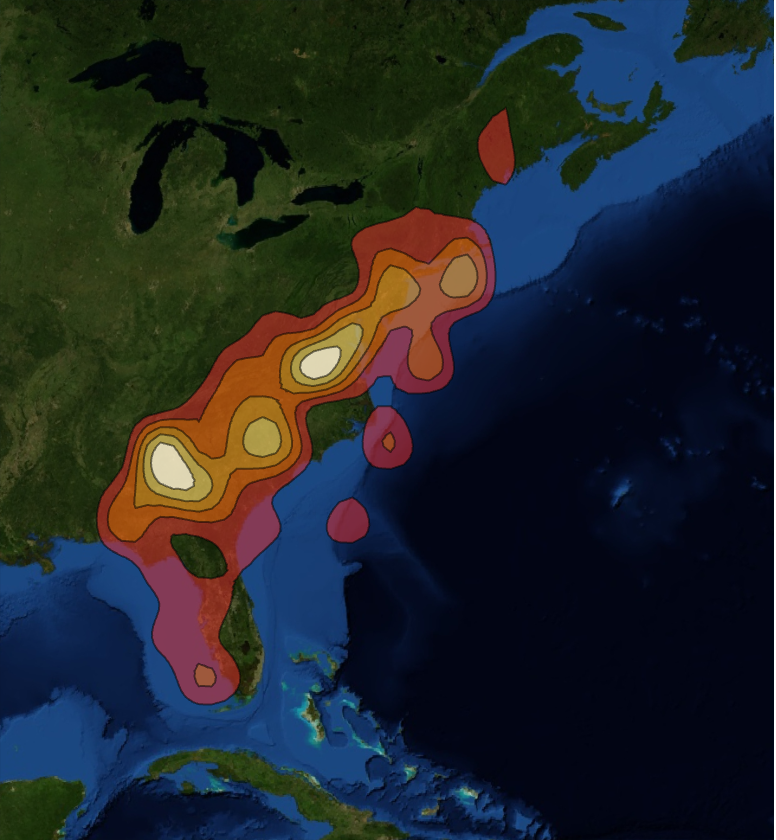 |
Make a contour plot for the rain totals for hurricane Sandy (2012), with a dark map background and shades of green:
| In[3]:= | ![ResourceFunction[
"TropicalStormRainContourPlot"]["NorthAtlantic", "Sandy", 2012, GeoBackground -> "VectorDark", GeoRange -> {{20, 50}, {-90, -60}}, ColorFunction -> "AvocadoColors"]](https://www.wolframcloud.com/obj/resourcesystem/images/9b8/9b8d2f21-0709-4eca-aa0c-9de6adbe5555/2a106ba6ac976c53.png) |
| Out[3]= | 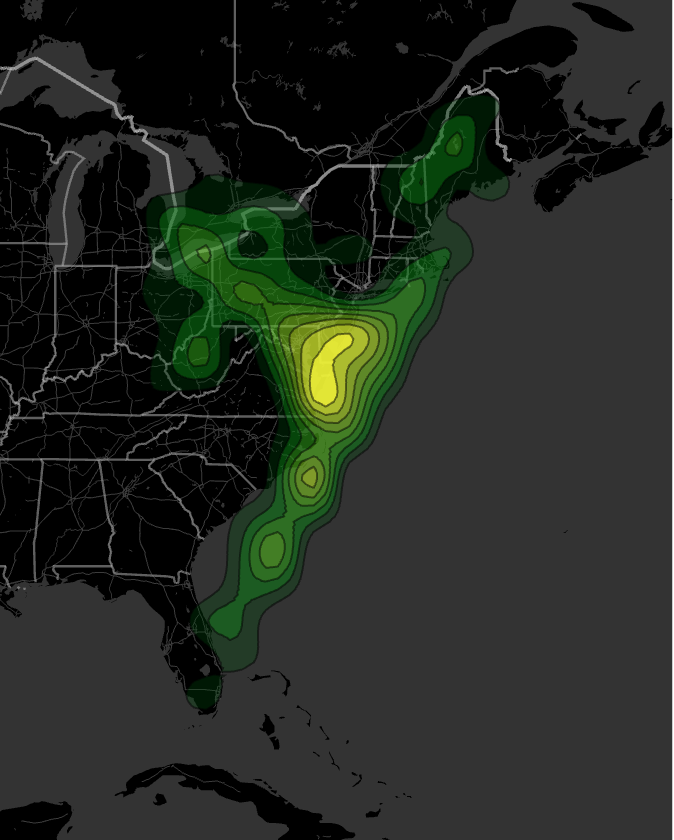 |
Not all known storms have rain data available to them. A message is issued if the given storm has no available rain data:
| In[4]:= |
| Out[4]= |
Wolfram Language 13.0 (December 2021) or above
This work is licensed under a Creative Commons Attribution 4.0 International License