Wolfram Research

Function Repository Resource:

SuggestPlotRange (5.1.0) current version: 6.0.0 »

Source Notebook

Get a variable range against which to plot a given function

Contributed by: Wolfram|Alpha Math Team

ResourceFunction["SuggestPlotRange"][expr,x]

tries to return a range in x that will produce a nice-looking plot of the expression expr versus x.

Details and Options

ResourceFunction["SuggestPlotRange"][expr, x] returns a result of the form {x, xmin, xmax} that can be used directly as a range specifier in Plot.
ResourceFunction["SuggestPlotRange"] takes the following options:
"Periods"Automatichow many periods of a periodic function to plot
"Range""Narrow"whether to give a "Narrow" or "Wide" plot range

Examples

Basic Examples (5) 

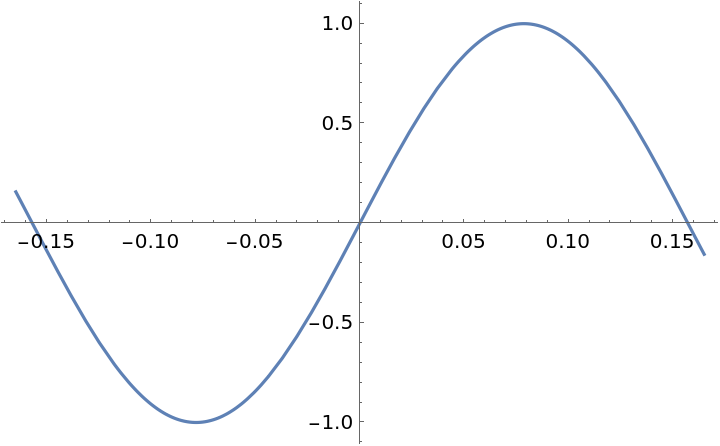
Suggest a plot range for a trigonometric function:

In[1]:=
func = Sin[20 x];
ResourceFunction["SuggestPlotRange"][func, x]
Out[2]=
In[3]:=
Plot[func, %]
Out[3]=

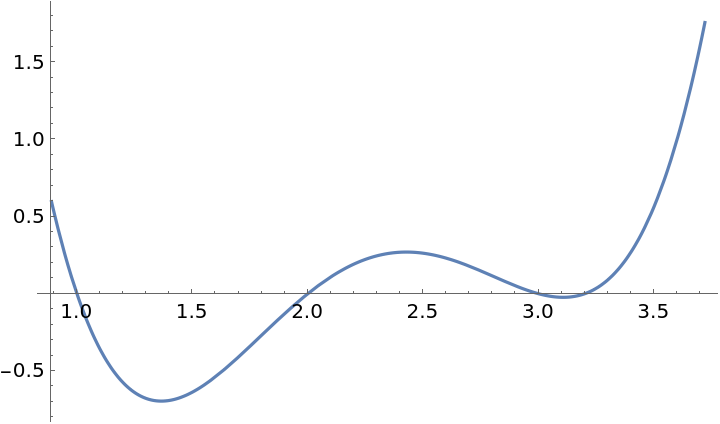
Suggest a plot range for a polynomial function:

In[4]:=
func = (x - 1) (x - 2) (x - 3) (x - 3.2);
ResourceFunction["SuggestPlotRange"][func, x]
Out[5]=
In[6]:=
Plot[func, %]
Out[6]=

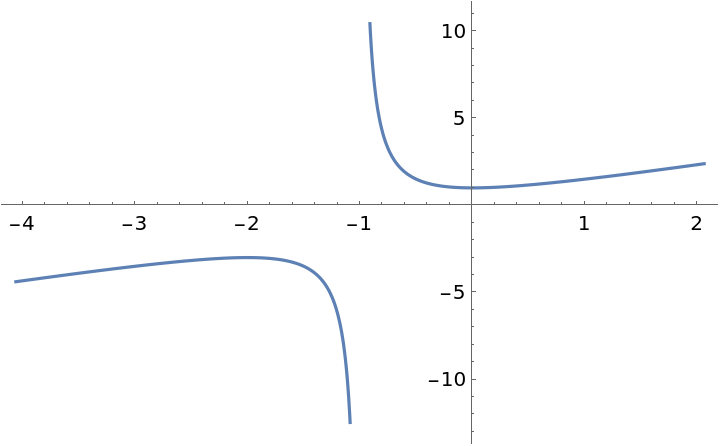
Suggest a plot range for a rational function:

In[7]:=
func = (x^2 + x + 1)/(x + 1);
ResourceFunction["SuggestPlotRange"][func, x]
Out[8]=
In[9]:=
Plot[func, %]
Out[9]=

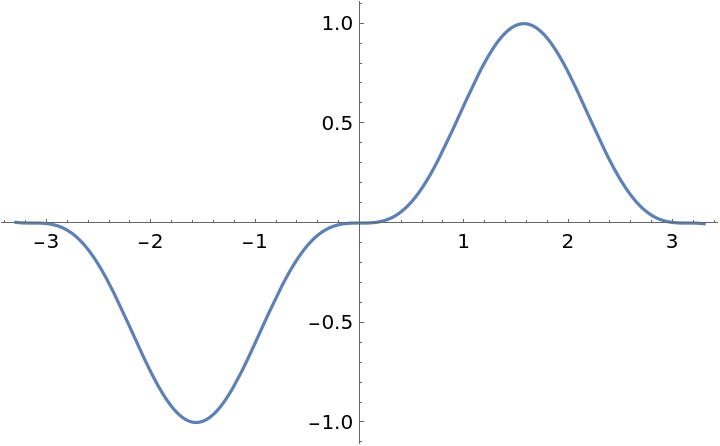
Suggest a plot range for a generic function:

In[10]:=
func = Sin[x]^3;
ResourceFunction["SuggestPlotRange"][func, x]
Out[11]=
In[12]:=
Plot[func, %]
Out[12]=

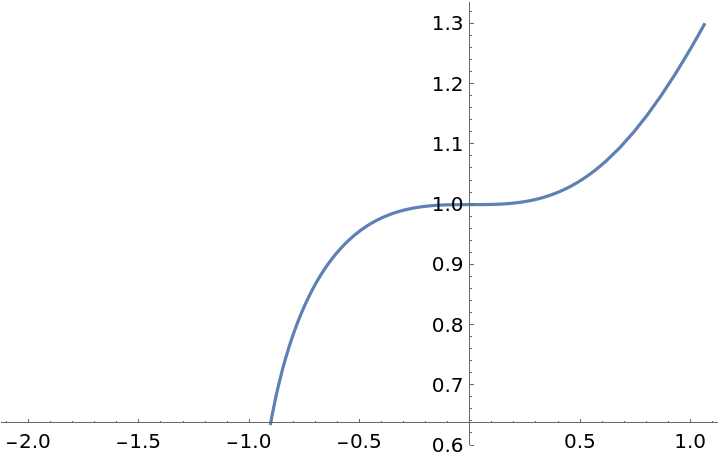
Suggest a plot range for another function:

In[13]:=
func = (x^3 + 1)^(1/3);
ResourceFunction["SuggestPlotRange"][func, x]
Out[14]=
In[15]:=
Plot[func, %]
Out[15]=

Options (2) 

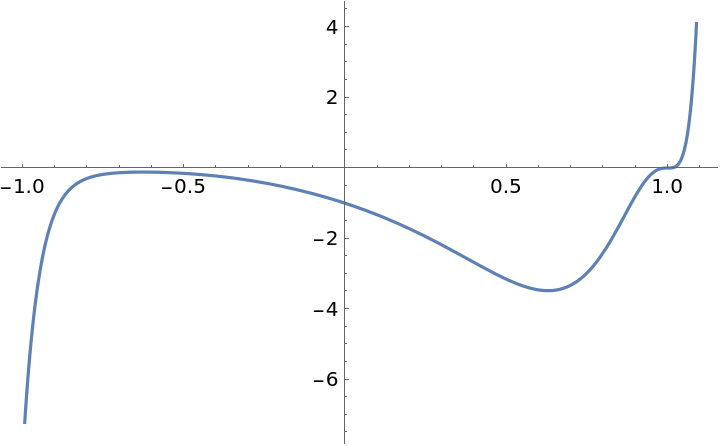
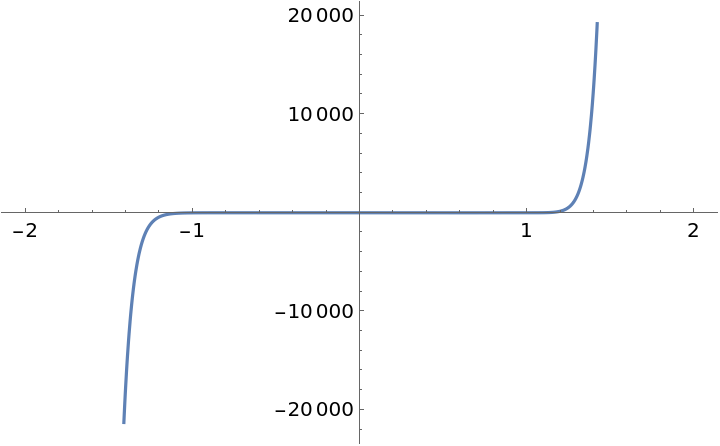
Using the option setting Range -> "Wide" will give a range showing more of the function but possibly revealing less detail:

In[16]:=
func = (x^5 + x^9 - x - 1)^3;
ResourceFunction["SuggestPlotRange"][func, x]
Out[17]=
In[18]:=
Plot[func, %]
Out[18]=
In[19]:=
ResourceFunction["SuggestPlotRange"][func, x, "Range" -> "Wide"]
Out[19]=
In[20]:=
Plot[func, %]
Out[20]=

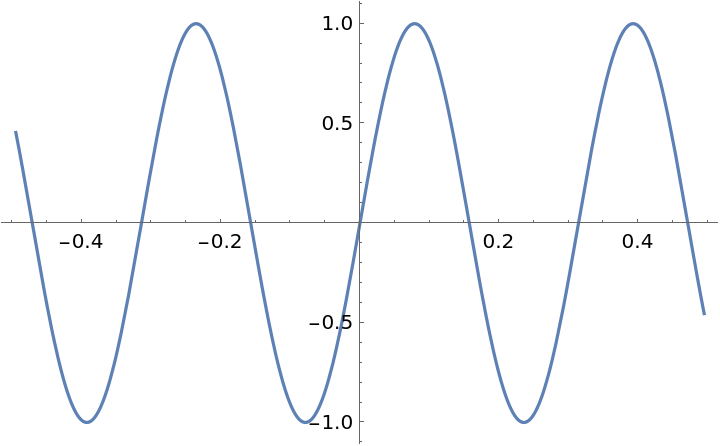
For periodic functions, the option setting "Periods"n will return a range covering the specified number of periods:

In[21]:=
func = Sin[20 x];
ResourceFunction["SuggestPlotRange"][func, x, "Periods" -> 3]
Out[22]=
In[23]:=
Plot[func, %]
Out[23]=

Publisher

Wolfram|Alpha Math Team

Version History

  • 6.0.0 – 23 March 2023
  • 5.1.0 – 12 May 2021
  • 5.0.0 – 24 January 2020
  • 4.0.0 – 10 September 2019
  • 3.0.0 – 06 September 2019
  • 2.0.0 – 12 June 2019
  • 1.0.0 – 22 February 2019

Related Resources
License Information