Wolfram Function Repository
Instant-use add-on functions for the Wolfram Language
Function Repository Resource:
Generate a plot illustrating causal features of substitution system evolution
ResourceFunction["SubstitutionSystemCausalPlot"][data] generates a plot showing the causal structure of a substitution system, using data generated by the resource function SubstitutionSystemCausalEvolution. |
| "CausalCone" | False | whether to show the causal cones |
| "CausalConeEdgeStyle" | Automatic | graphics directives to specify the style for the causal cone edges |
| "CausalConeEventStyle" | Automatic | graphics directives to specify the style for the causal cones |
| "CausalConeRoot" | 1 | root vertex for the causal cone |
| "CausalGraph" | False | whether to show the causal graph |
| "CausalGraphStyle" | Automatic | graphics directives to specify the style for the edges of the causal graph |
| "CellLabels" | False | whether to show cell labels |
| "CellLabelStyles" | <||> | style specifications for cell labels |
| "ColorTable" | Automatic | colors to use for the cells |
| "EventHeight" | 1 | height of a cell corresponding to an event |
| "EventLabels" | False | whether to show labels of the events |
| "EventPolygonStyle" | Automatic | graphics directives to specify the style for the event polygons |
| "NumberSize" | 10. | font size of the number labels |
| "SpaceSurfaceStyle" | Automatic | graphics directives to specify the style for the space surface |
| "VerticalGridLinesStyle" | White | graphics directives to specify the style for the vertical grid lines |
Generate a causal history for a substitution system, using a localized pseudorandom generator to standardize the replacement choices in the specified random update scheme:
| In[1]:= | ![evo = BlockRandom[SeedRandom[2635]; ResourceFunction[
"SubstitutionSystemCausalEvolution"][{"AB" -> "BA"}, "ABABBABBAAABABAAAABAABBB", 20, {"Random", 4}]]](https://www.wolframcloud.com/obj/resourcesystem/images/f10/f1017d3c-27ca-44bf-b3c5-9b3a9cf17b4a/4b570669ba14b12b.png) |
| Out[1]= |  |
Visualize the evolution's causal structure:
| In[2]:= |
| Out[2]= | 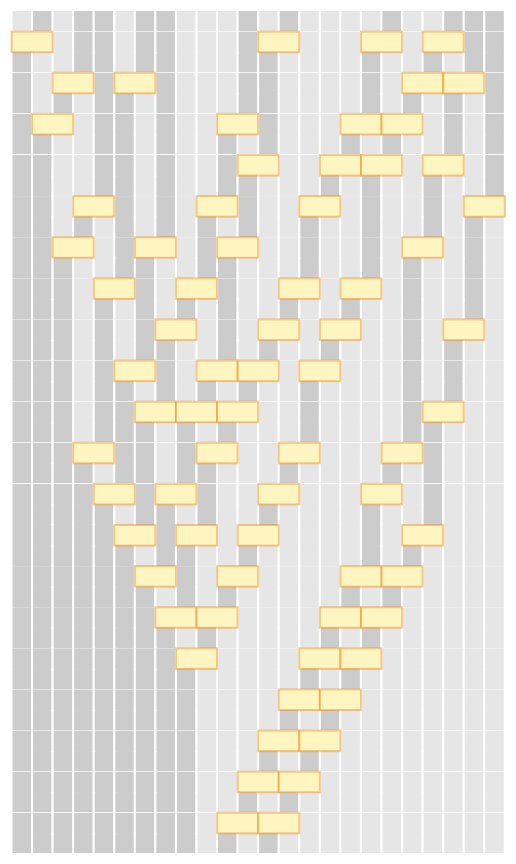 |
Show the causal graph and label the events:
| In[3]:= |
| Out[3]= | 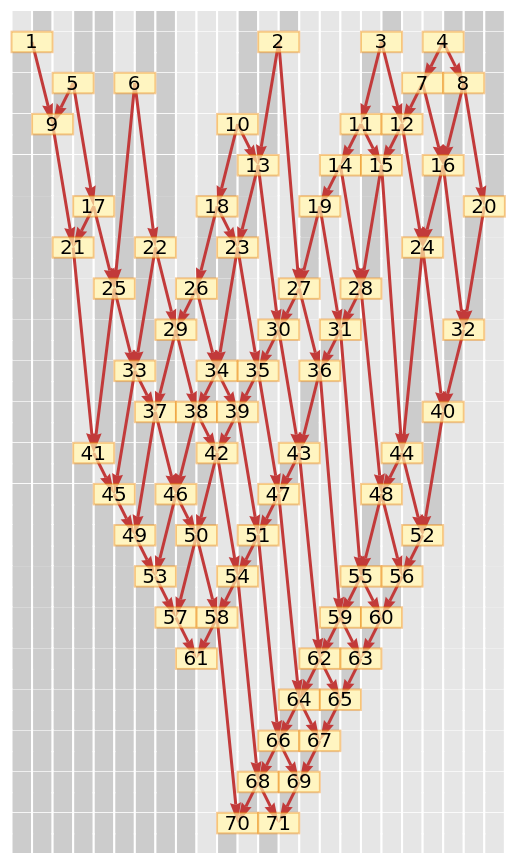 |
Visualize the causal structure for various updating schemes:
| In[4]:= | ![Table[ResourceFunction["SubstitutionSystemCausalPlot"][
ResourceFunction[
"SubstitutionSystemCausalEvolution"][{"AB" -> "BA"}, "ABABBABBAAABABAAAABAABBB", 10, type], "CausalGraph" -> True, "EventLabels" -> True, PlotLabel -> type], {type, {"Forward", "Backward", "Sequential", "First"}}] // GraphicsRow](https://www.wolframcloud.com/obj/resourcesystem/images/f10/f1017d3c-27ca-44bf-b3c5-9b3a9cf17b4a/429e84235e4769d3.png) |
| Out[4]= |  |
Display the causal cones for a causal structure:
| In[5]:= | ![ResourceFunction["SubstitutionSystemCausalPlot"][
ResourceFunction[
"SubstitutionSystemCausalEvolution"][{"AB" -> "BA", "AA" -> "BAB"}, "BBAAABAABBABBABA", 7], "CausalCone" -> True]](https://www.wolframcloud.com/obj/resourcesystem/images/f10/f1017d3c-27ca-44bf-b3c5-9b3a9cf17b4a/3809bf02537a2324.png) |
| Out[5]= | 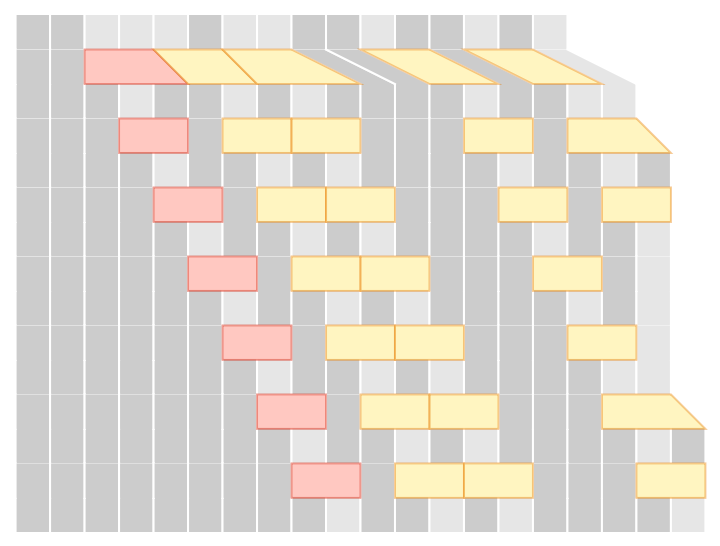 |
Change the style for the causal cones:
| In[6]:= | ![ResourceFunction["SubstitutionSystemCausalPlot"][
ResourceFunction[
"SubstitutionSystemCausalEvolution"][{"AB" -> "BA", "AA" -> "BAB"}, "BBAAABAABBABBABA", 7], "CausalCone" -> True, "CausalConeEventStyle" -> LightGreen]](https://www.wolframcloud.com/obj/resourcesystem/images/f10/f1017d3c-27ca-44bf-b3c5-9b3a9cf17b4a/4f0fe6714e3bfdd4.png) |
| Out[6]= | 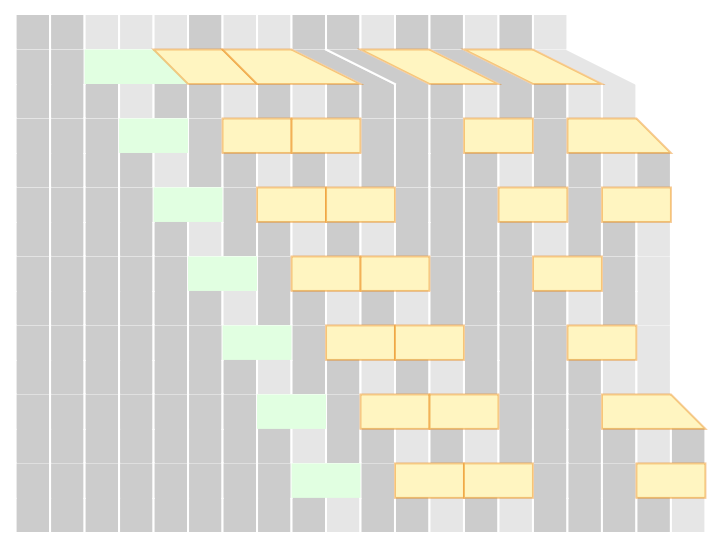 |
Use a different root for the causal cones:
| In[7]:= | ![ResourceFunction["SubstitutionSystemCausalPlot"][
ResourceFunction[
"SubstitutionSystemCausalEvolution"][{"AB" -> "BA", "AA" -> "BAB"}, "BBAAABAABBABBABA", 7], "CausalCone" -> True, "CausalConeRoot" -> 3]](https://www.wolframcloud.com/obj/resourcesystem/images/f10/f1017d3c-27ca-44bf-b3c5-9b3a9cf17b4a/3ee3f4eee4f554e6.png) |
| Out[7]= | 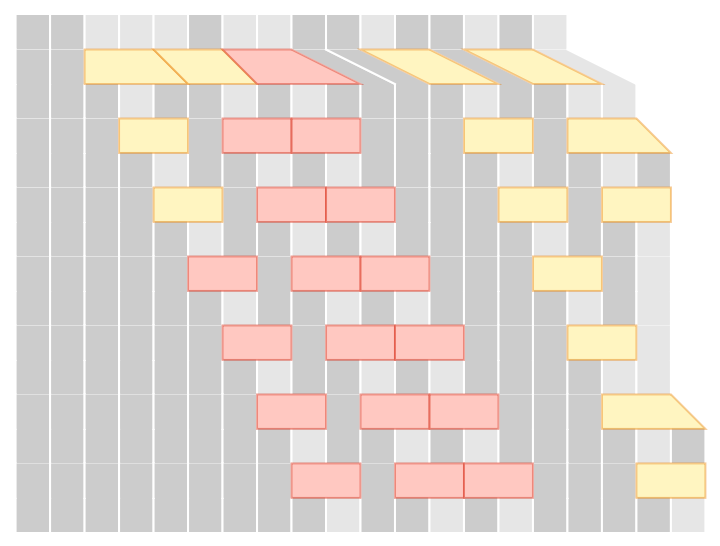 |
Show the causal graph:
| In[8]:= | ![ResourceFunction["SubstitutionSystemCausalPlot"][
ResourceFunction[
"SubstitutionSystemCausalEvolution"][{"AB" -> "BA", "AA" -> "BAB"}, "BBAAABAABBABBABA", 7], "CausalGraph" -> True]](https://www.wolframcloud.com/obj/resourcesystem/images/f10/f1017d3c-27ca-44bf-b3c5-9b3a9cf17b4a/69ea49f09b5b156a.png) |
| Out[8]= | 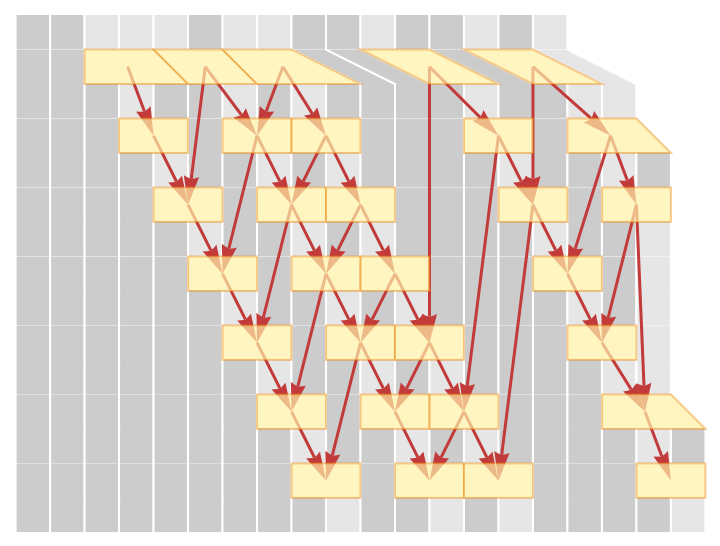 |
Change the style of the causal graph:
| In[9]:= | ![ResourceFunction["SubstitutionSystemCausalPlot"][
ResourceFunction[
"SubstitutionSystemCausalEvolution"][{"AB" -> "BA", "AA" -> "BAB"}, "BBAAABAABBABBABA", 7], "CausalGraph" -> True, "CausalGraphStyle" -> Directive[Arrowheads[Small], ColorData[97, 1]]]](https://www.wolframcloud.com/obj/resourcesystem/images/f10/f1017d3c-27ca-44bf-b3c5-9b3a9cf17b4a/520f3b78655c1710.png) |
| Out[9]= | 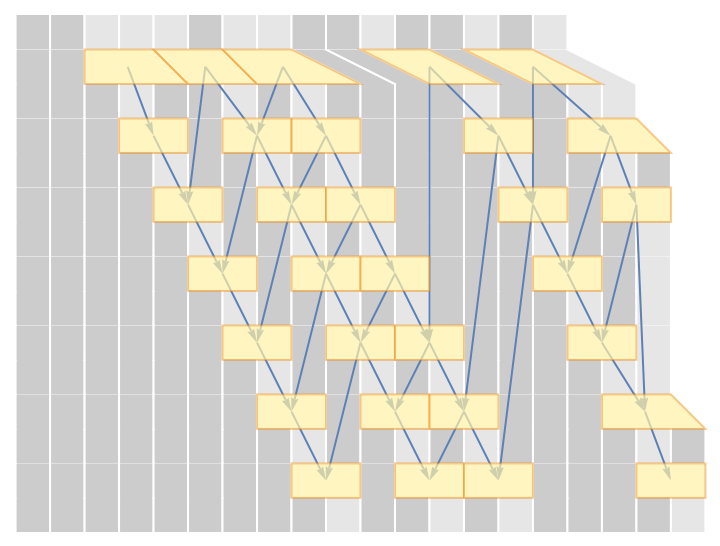 |
Show the cell labels:
| In[10]:= | ![ResourceFunction["SubstitutionSystemCausalPlot"][
ResourceFunction[
"SubstitutionSystemCausalEvolution"][{"AB" -> "BA", "AA" -> "BAB"}, "BBAAABAABBABBABA", 7], "CellLabels" -> True]](https://www.wolframcloud.com/obj/resourcesystem/images/f10/f1017d3c-27ca-44bf-b3c5-9b3a9cf17b4a/751f416c30a30878.png) |
| Out[10]= |  |
Use different styles for the cell labels:
| In[11]:= | ![ResourceFunction["SubstitutionSystemCausalPlot"][
ResourceFunction[
"SubstitutionSystemCausalEvolution"][{"AB" -> "BA", "AA" -> "BAB"}, "BBAAABAABBABBABA", 7], "CellLabels" -> True, "CellLabelStyles" -> <|"A" -> ColorData[61, 1], "B" -> ColorData[61, 3]|>]](https://www.wolframcloud.com/obj/resourcesystem/images/f10/f1017d3c-27ca-44bf-b3c5-9b3a9cf17b4a/228ba7085012a49d.png) |
| Out[11]= | 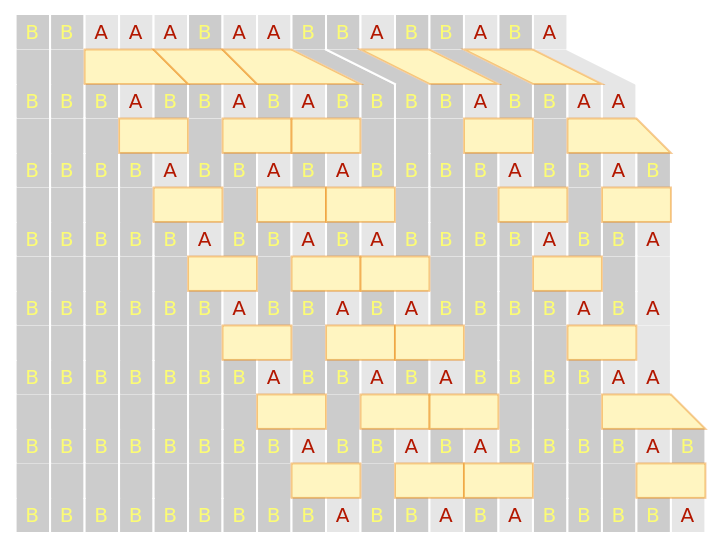 |
Use different colors for the cells:
| In[12]:= | ![ResourceFunction["SubstitutionSystemCausalPlot"][
ResourceFunction[
"SubstitutionSystemCausalEvolution"][{"AB" -> "BA", "AA" -> "BAB"}, "BBAAABAABBABBABA", 7], "ColorTable" -> ColorData[61, "ColorList"]]](https://www.wolframcloud.com/obj/resourcesystem/images/f10/f1017d3c-27ca-44bf-b3c5-9b3a9cf17b4a/05043445303da2cf.png) |
| Out[12]= | 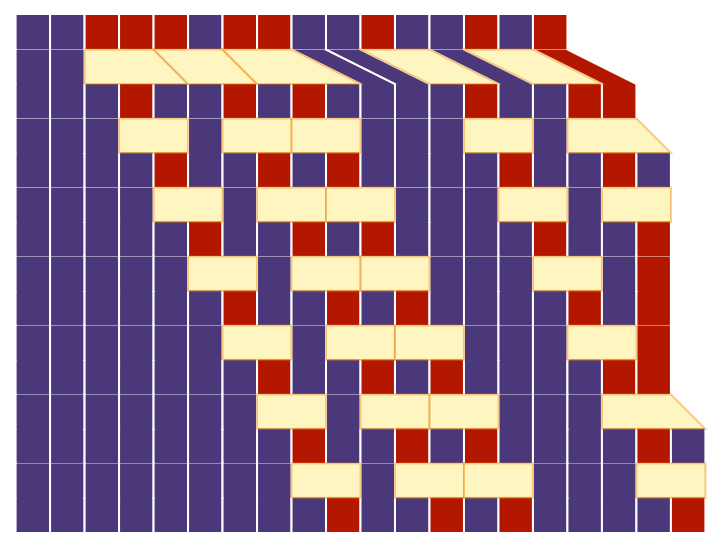 |
Show at different event heights:
| In[13]:= | ![GraphicsRow[{ResourceFunction["SubstitutionSystemCausalPlot"][
ResourceFunction[
"SubstitutionSystemCausalEvolution"][{"AB" -> "BA", "AA" -> "BAB"}, "BBAAABAABBABBABA", 7], "EventHeight" -> 1], ResourceFunction["SubstitutionSystemCausalPlot"][
ResourceFunction[
"SubstitutionSystemCausalEvolution"][{"AB" -> "BA", "AA" -> "BAB"}, "BBAAABAABBABBABA", 7], "EventHeight" -> 1.5]}, ImageSize -> Large]](https://www.wolframcloud.com/obj/resourcesystem/images/f10/f1017d3c-27ca-44bf-b3c5-9b3a9cf17b4a/21a2366c55a1257a.png) |
| Out[13]= | 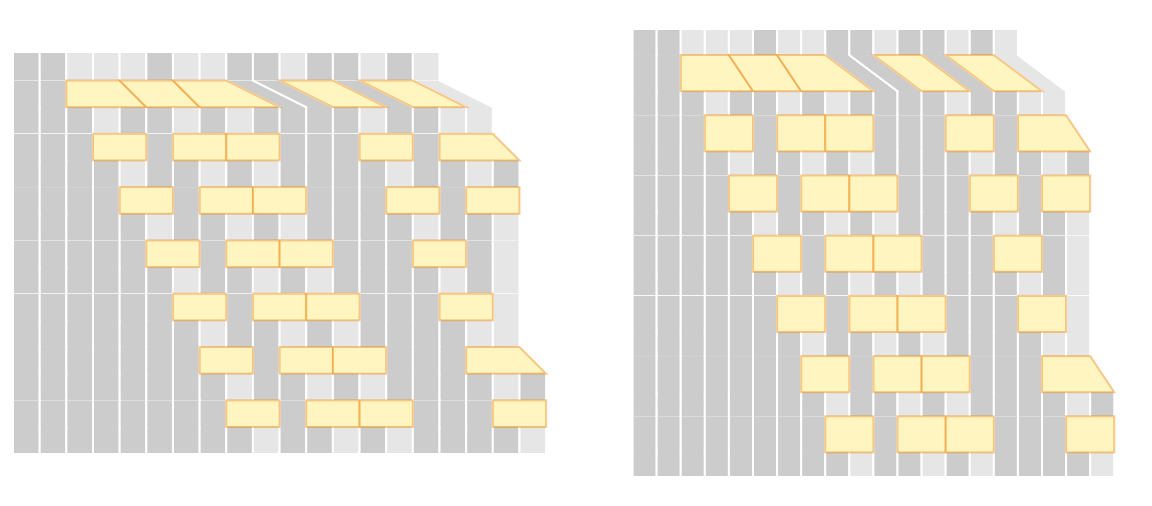 |
Show labels for the events:
| In[14]:= | ![ResourceFunction["SubstitutionSystemCausalPlot"][
ResourceFunction[
"SubstitutionSystemCausalEvolution"][{"AB" -> "BA", "AA" -> "BAB"}, "BBAAABAABBABBABA", 7], "EventLabels" -> True]](https://www.wolframcloud.com/obj/resourcesystem/images/f10/f1017d3c-27ca-44bf-b3c5-9b3a9cf17b4a/379cad3184fba076.png) |
| Out[14]= |  |
Use a different style for the events:
| In[15]:= | ![ResourceFunction["SubstitutionSystemCausalPlot"][
ResourceFunction[
"SubstitutionSystemCausalEvolution"][{"AB" -> "BA", "AA" -> "BAB"}, "BBAAABAABBABBABA", 7], "EventPolygonStyle" -> Orange]](https://www.wolframcloud.com/obj/resourcesystem/images/f10/f1017d3c-27ca-44bf-b3c5-9b3a9cf17b4a/3a53a13c86bbe3cd.png) |
| Out[15]= | 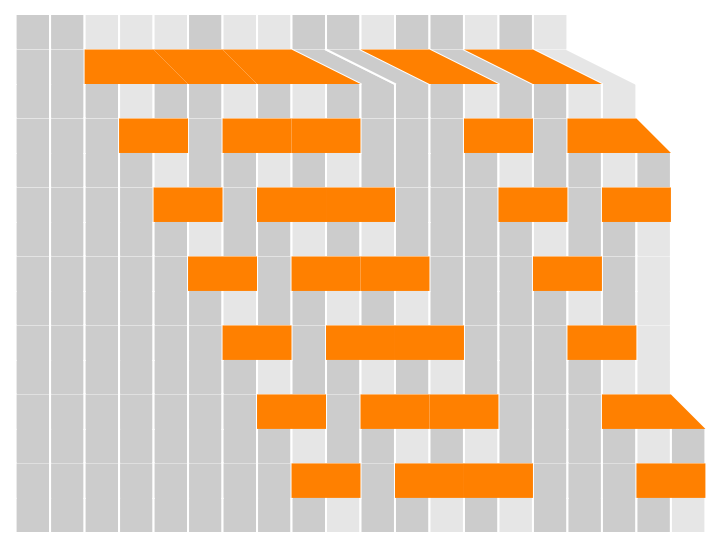 |
Show the event labels with a larger font size:
| In[16]:= | ![ResourceFunction["SubstitutionSystemCausalPlot"][
ResourceFunction[
"SubstitutionSystemCausalEvolution"][{"AB" -> "BA", "AA" -> "BAB"}, "BBAAABAABBABBABA", 7], "EventLabels" -> True, "NumberSize" -> 14.]](https://www.wolframcloud.com/obj/resourcesystem/images/f10/f1017d3c-27ca-44bf-b3c5-9b3a9cf17b4a/25683181f97bb5b3.png) |
| Out[16]= | 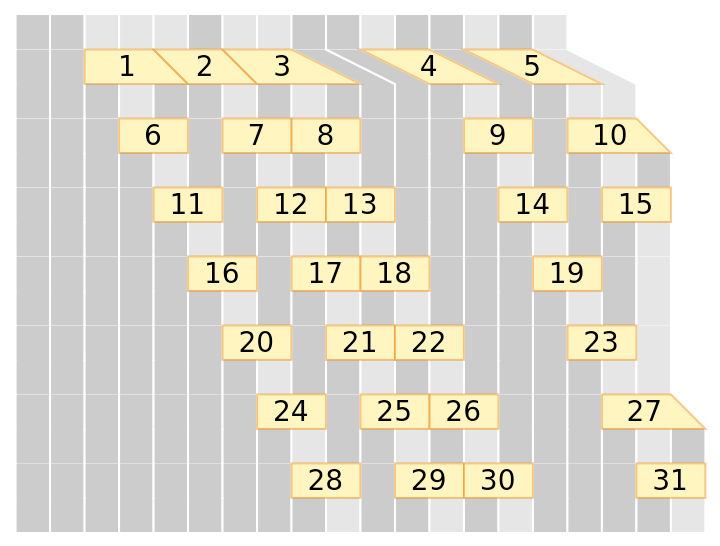 |
Use a different style for the vertical grid lines:
| In[17]:= | ![ResourceFunction["SubstitutionSystemCausalPlot"][
ResourceFunction[
"SubstitutionSystemCausalEvolution"][{"AB" -> "BA", "AA" -> "BAB"}, "BBAAABAABBABBABA", 7], "VerticalGridLinesStyle" -> Pink]](https://www.wolframcloud.com/obj/resourcesystem/images/f10/f1017d3c-27ca-44bf-b3c5-9b3a9cf17b4a/781a2371ea045cf8.png) |
| Out[17]= |  |
This work is licensed under a Creative Commons Attribution 4.0 International License