Wolfram Function Repository
Instant-use add-on functions for the Wolfram Language
Function Repository Resource:
Show the spherical Voronoi diagram of a set of points on a sphere
ResourceFunction["SphericalVoronoiDiagram"][{p1,…,pn}] generates a three-dimensional plot representing the spherical Voronoi diagram of the points pi. |
| Boxed | False | whether to draw the bounding box |
| EdgeStyle | Automatic | graphics directives to specify the style for the edges |
| "PointStyle" | Automatic | graphics directives to specify the style for the generating points |
| "ShowOriginalPoints" | False | whether to show the generating points |
| "SphereStyle" | Automatic | graphics directives to specify the style for the sphere |
Spherical Voronoi diagram of two and three points:
| In[2]:= |
| Out[2]= | 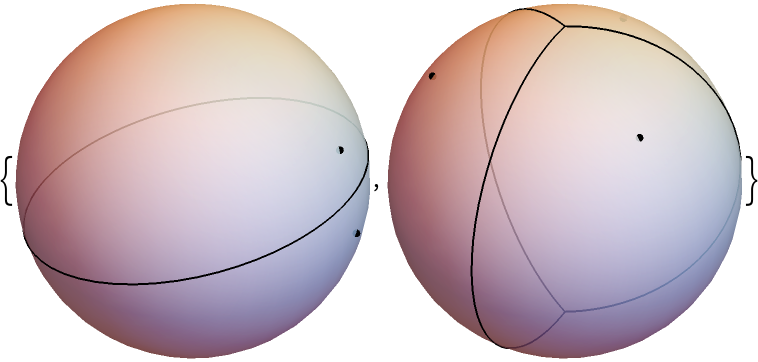 |
Spherical Voronoi diagram of randomly generated points:
| In[3]:= |
| Out[3]= | 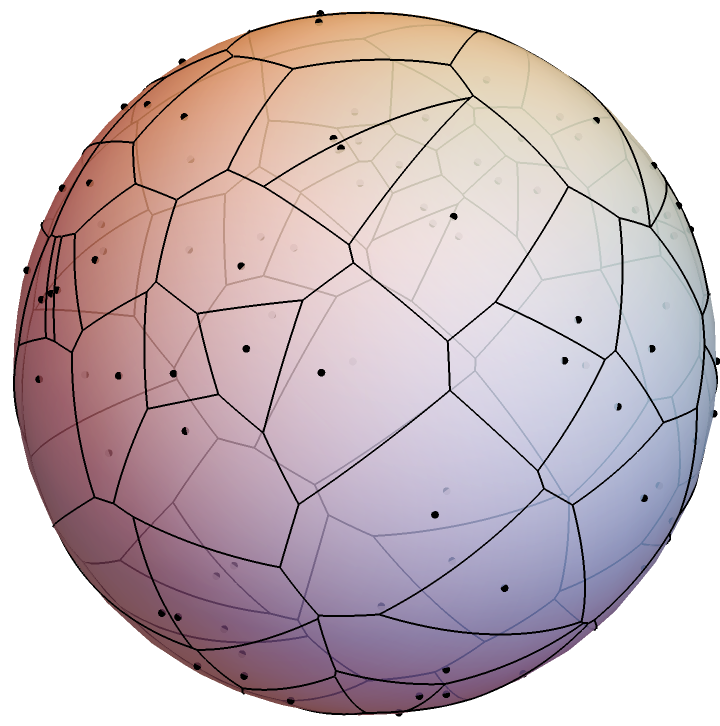 |
Change the style of the edges:
| In[4]:= |
| Out[4]= | 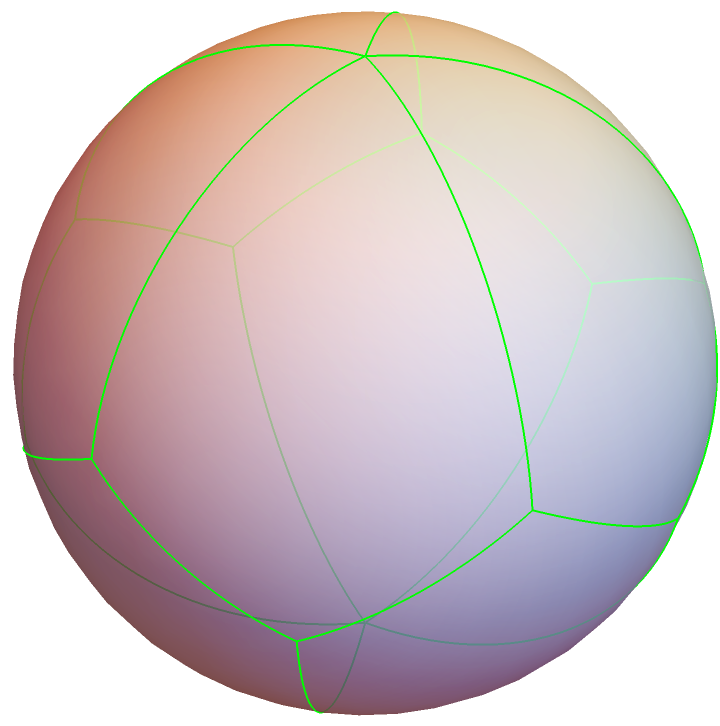 |
Change the style of the generating points:
| In[5]:= |
| Out[5]= | 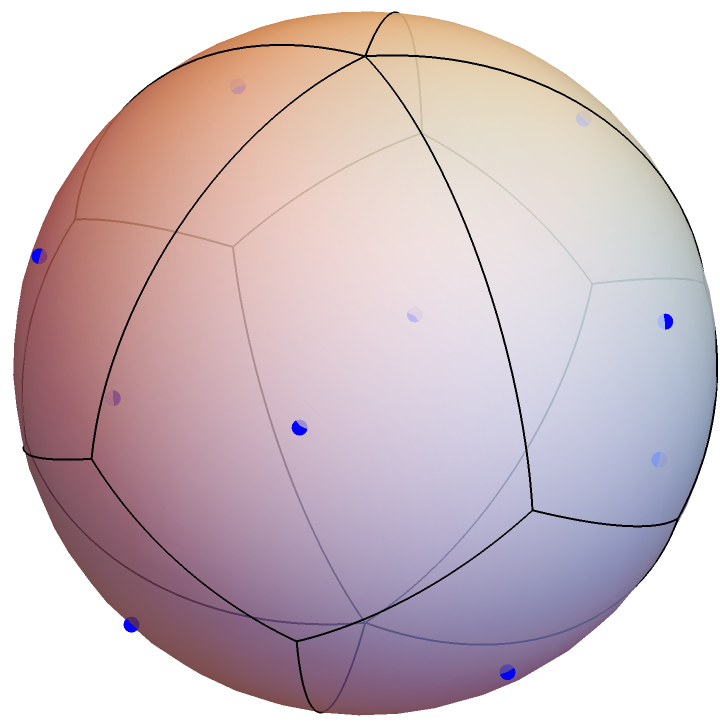 |
Show the spherical Voronoi diagram with and without the generating points:
| In[6]:= |
| Out[6]= | 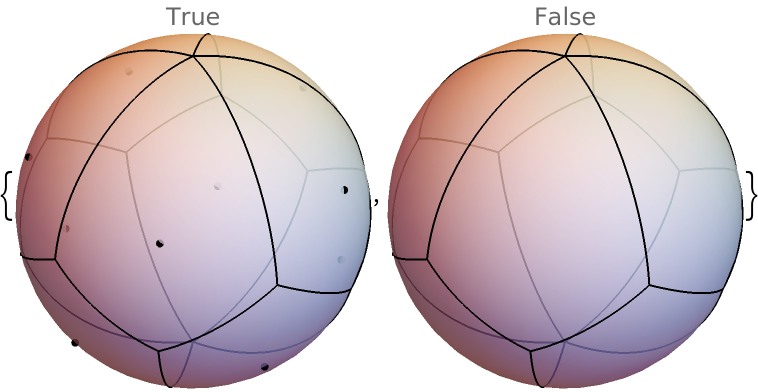 |
Change the style of the sphere:
| In[7]:= |
| Out[7]= | 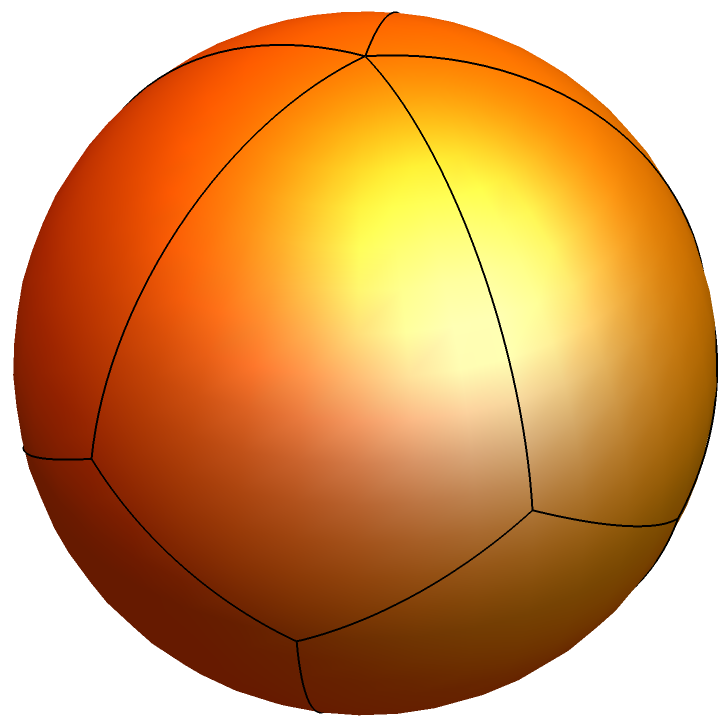 |
Use tubes and spheres to render the spherical Voronoi diagram and its generating points:
| In[8]:= | ![ResourceFunction["SphericalVoronoiDiagram"][RandomPoint[Sphere[], 88],
EdgeStyle -> Green, "PointStyle" -> Brown, "ShowOriginalPoints" -> True] /. {b_BSplineCurve :> Tube[b], Point[p_] :> Sphere[p, 0.02]}](https://www.wolframcloud.com/obj/resourcesystem/images/859/85963ceb-b393-4cc5-919c-067a11e13c40/338bf689bb442d57.png) |
| Out[8]= | 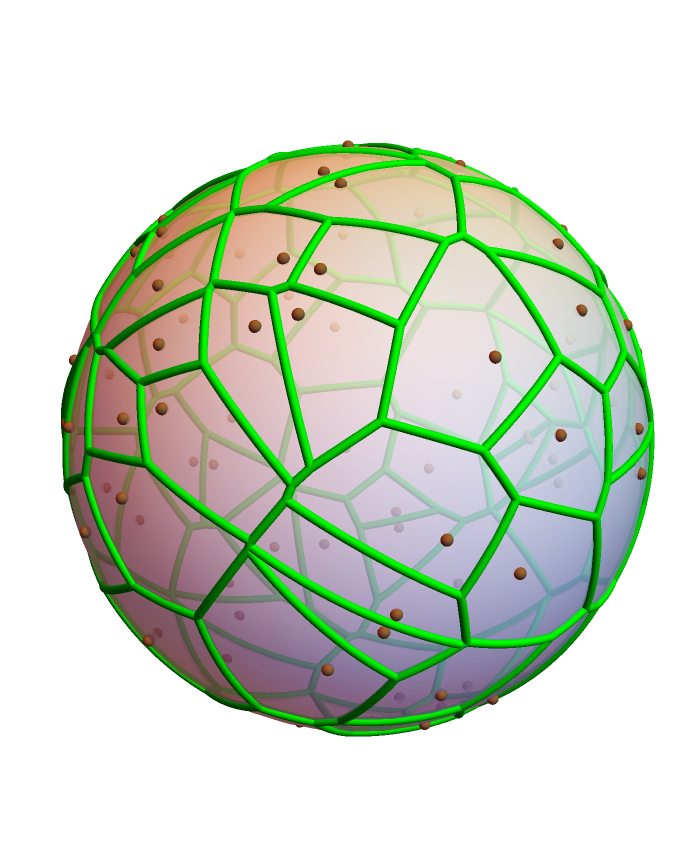 |
Locations of the state capitals of the contiguous United States:
| In[9]:= | ![stateCapitals = {Cos[#1] Cos[#2 - \[Pi]], Cos[#1] Sin[#2 - \[Pi]], Sin[#1]} & @@@ QuantityMagnitude[
UnitConvert[
LatitudeLongitude[
GeoPosition[
EntityClass["AdministrativeDivision", "ContinentalUSStates"][
EntityProperty["AdministrativeDivision", "CapitalCity"]]]], "Radians"]]](https://www.wolframcloud.com/obj/resourcesystem/images/859/85963ceb-b393-4cc5-919c-067a11e13c40/4c80654e73b006b4.png) |
| Out[9]= |  |
Display them in a spherical Voronoi diagram:
| In[10]:= | ![Show[ResourceFunction["GeoGraphics3D"][{}, GeoBackground -> "ReliefMap"], DeleteCases[
ResourceFunction["SphericalVoronoiDiagram"][stateCapitals, EdgeStyle -> Directive[Blue, AbsoluteThickness[3]], "PointStyle" -> Directive[Red, AbsolutePointSize[6]], "ShowOriginalPoints" -> True], _Sphere, \[Infinity]], Lighting -> "Neutral"]](https://www.wolframcloud.com/obj/resourcesystem/images/859/85963ceb-b393-4cc5-919c-067a11e13c40/4206b2be4fb8734d.png) |
| Out[10]= | 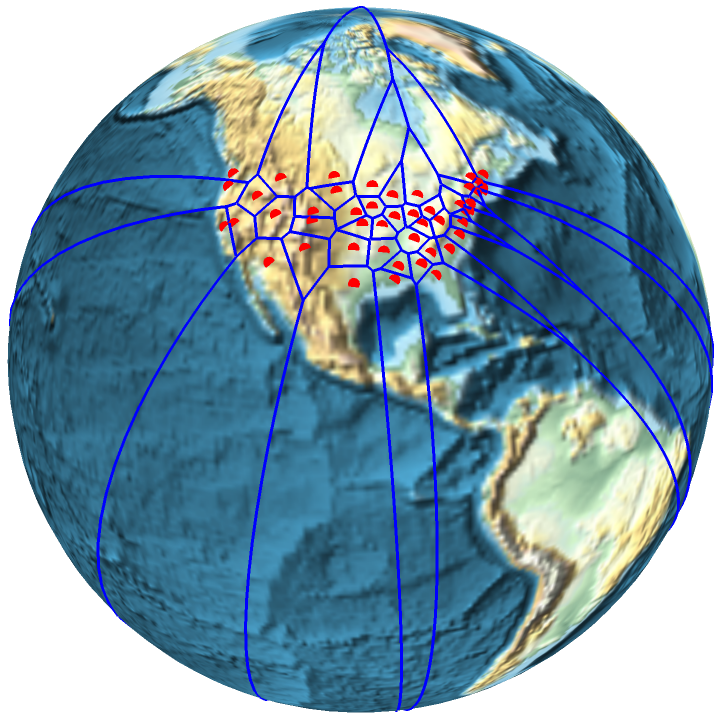 |
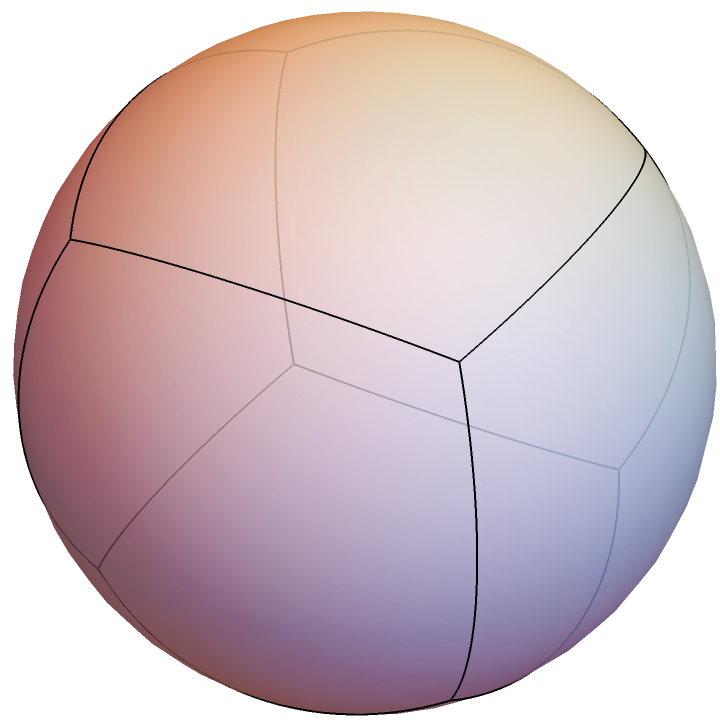
Spherical Voronoi diagram of the vertices of a pentakis dodecahedron:
| In[11]:= |
| Out[11]= | 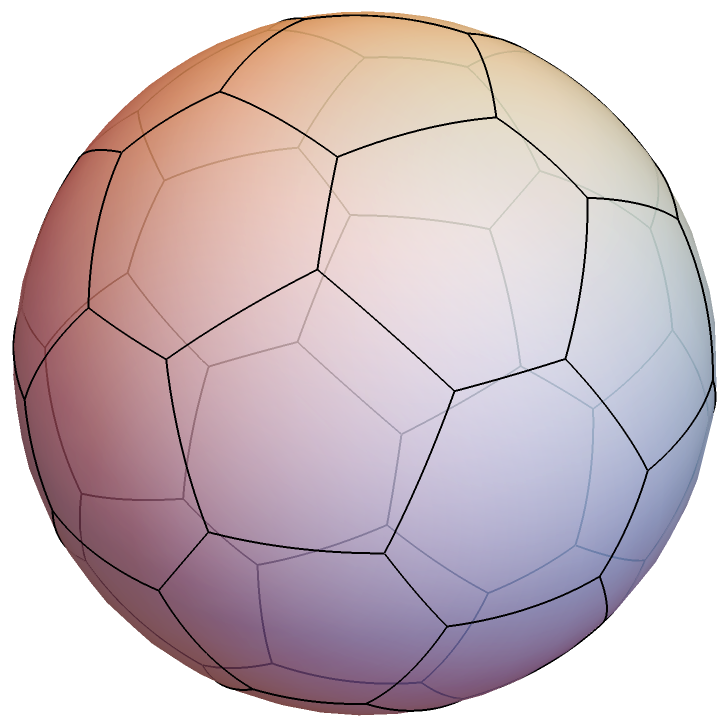 |
This work is licensed under a Creative Commons Attribution 4.0 International License