Function Repository Resource:

SpaceWeatherData

Source Notebook

Get time-dependent data for a variety of space weather properties

Contributed by: Jeff Bryant

ResourceFunction["SpaceWeatherData"]["Properties"]

gives a list of properties that are available.

ResourceFunction["SpaceWeatherData"][prop]

gives a property association of the most recent values of all available properties.

ResourceFunction["SpaceWeatherData"][date,prop]

gives either a value or values of the specifed property on the specified date.

ResourceFunction["SpaceWeatherData"][{startdate,enddate},prop]

gives the value or values of the property between startdate and enddate.

Details and Options

Space weather is a collection of phenomena that describe the interaction between the Earth and Sun, typically related to energetic events such as solar flares originating from areas with sunspots, as well as the solar wind and its effects on the Earth's magnetic field and atmosphere. Space weather has direct influences on power grids, spacecraft operations and communication, as well as the safety of astronauts due to radiation exposure.
Use of ResourceFunction["SpaceWeatherData"] requires an internet network connection.
The range of dates over which data is available varies depending on the property.
The time resolution of the data varies depending on the property.
For data that has time resolution of a day or less, the times are given in GMT.
Date specifications that result in a single value will return that single value; otherwise a TimeSeries will be returned.
The following properties are available:
"DailySunspotNumber"daily sunspot number
"IMFBMagnitude"magnitude of the interplanetary magnetic field
"IMFBx"x‐component of the interplanetary magnetic field
"IMFBy"y‐component of the interplanetary magnetic field
"IMFBz"z‐component of the interplanetary magnetic field
"LongSolarXRayFlux"solar x‐ray flux (0.1–0.8 nm)
"MonthlySunspotNumber"monthly averaged sunspot number
"PlanetaryKIndex"planetary K‐index
"ShortSolarXRayFlux"solar x‐ray flux (0.05–0.4 nm)
"SolarWindBulkSpeed"bulk speed of the solar wind
"SolarWindIonTemperature"ion temperature of the solar wind
"SolarWindProtonDensity"proton density of the solar wind
"TenDotSevenCMSolarRadioFlux"solar radio flux at 10.7 cm wavelength
"YearlySunspotNumber"yearly averaged sunspot number
ResourceFunction["SpaceWeatherData"][] is equivalent to ResourceFunction["SpaceWeatherData"]["PropertyAssociation"].

Examples

Basic Examples (5) 

List all available properties:

In[1]:=
ResourceFunction[
 "SpaceWeatherData", ResourceSystemBase -> "https://www.wolframcloud.com/obj/resourcesystem/api/1.0"]["Properties"]
Out[1]=

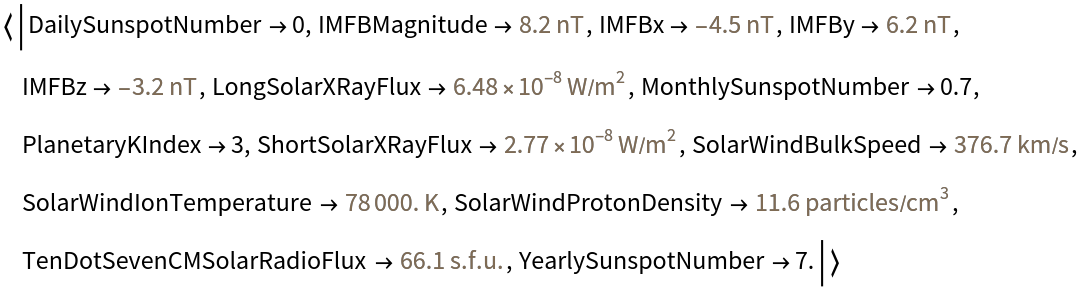
Get an Association of the most recent values:

In[2]:=
ResourceFunction[
 "SpaceWeatherData", ResourceSystemBase -> "https://www.wolframcloud.com/obj/resourcesystem/api/1.0"][]
Out[2]=

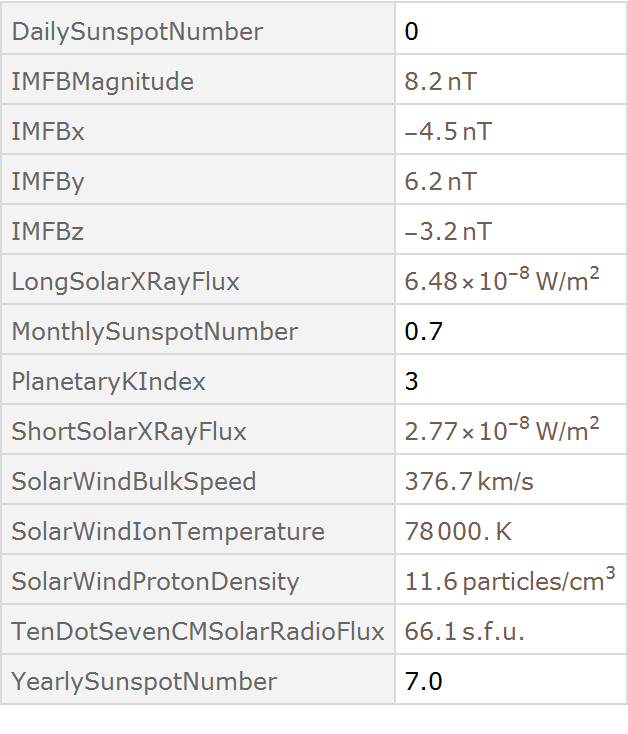
Get a dataset of the most recent values:

In[3]:=
ResourceFunction[
 "SpaceWeatherData", ResourceSystemBase -> "https://www.wolframcloud.com/obj/resourcesystem/api/1.0"]["Dataset"]
Out[3]=

Obtain the most recent daily sunspot number:

In[4]:=
ResourceFunction[
 "SpaceWeatherData", ResourceSystemBase -> "https://www.wolframcloud.com/obj/resourcesystem/api/1.0"]["DailySunspotNumber"]
Out[4]=

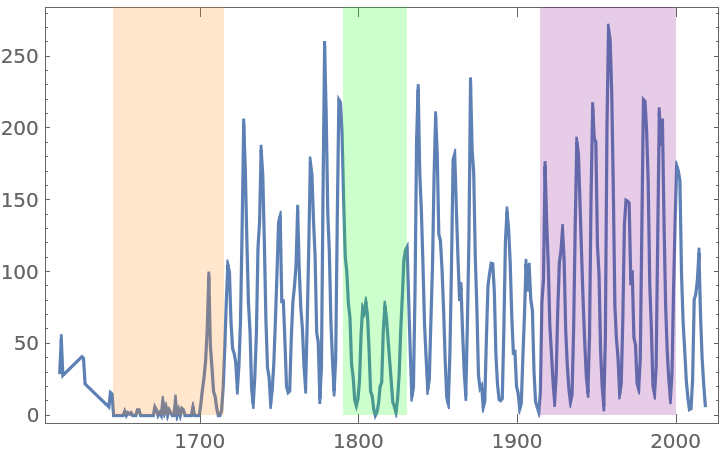
Obtain a time series of the yearly averaged sunspot number since 1611:

In[5]:=
ResourceFunction[
 "SpaceWeatherData", ResourceSystemBase -> "https://www.wolframcloud.com/obj/resourcesystem/api/1.0"][{DateObject[{1611}], DateObject[{2018}]}, "YearlySunspotNumber"]
Out[5]=

Applications (19) 

Sunspots (6) 

Sunspots are measured using a "number" that correlates to a "count" but is not directly equal to the number of sunspots one would expect to see. You can divide the number by 15 to get an approximate idea of how many sunspots might have been visible to the naked eye at the time of the query. Data is available at different temporal resolutions: a daily value, monthly averaged value and a yearly averaged value. It represents the "international sunspot number" issued by the Royal Observatory of Belgium.

Find the current daily sunspot number:

In[6]:=
ResourceFunction[
 "SpaceWeatherData", ResourceSystemBase -> "https://www.wolframcloud.com/obj/resourcesystem/api/1.0"]["DailySunspotNumber"]
Out[6]=

Find the current monthly averaged sunspot number:

In[7]:=
ResourceFunction[
 "SpaceWeatherData", ResourceSystemBase -> "https://www.wolframcloud.com/obj/resourcesystem/api/1.0"][
 DateObject[{2013, 3}], "MonthlySunspotNumber"]
Out[7]=

Find the current yearly averaged sunspot number:

In[8]:=
ResourceFunction[
 "SpaceWeatherData", ResourceSystemBase -> "https://www.wolframcloud.com/obj/resourcesystem/api/1.0"][DateObject[{2013}], "YearlySunspotNumber"]
Out[8]=

The yearly averaged value allows you to see the 11‐year sunspot cycle going all the way back to 1611. Of particular interest is the Maunder Minimum (orange) prior to 1700, where the sunspot cycle seemed to stop for a number of years. Another event, the Dalton Minimum (green), happened between about 1790 and 1830, and showed a reduced period of solar variability of sunspots. The Modern Maximum lasted between approximately 1915 and 2000, with the end in question, as it may extend into the latest sunspot cycle:

In[9]:=
annualsunspotts = ResourceFunction[
  "SpaceWeatherData", ResourceSystemBase -> "https://www.wolframcloud.com/obj/resourcesystem/api/1.0"][{DateObject[{1611}], DateObject[{2018}]}, "YearlySunspotNumber"]
Out[9]=
In[10]:=
DateListPlot[annualsunspotts, FrameLabel -> {None, Automatic}, Epilog -> {Orange, Opacity[.2], Rectangle[{AbsoluteTime[{1645}], 0}, {AbsoluteTime[{1715}], 300}], Green, Rectangle[{AbsoluteTime[{1790}], 0}, {AbsoluteTime[{1830}], 300}], Purple, Rectangle[{AbsoluteTime[{1914}], 0}, {AbsoluteTime[{2000}], 300}]}]
Out[10]=

Individual sunspot cycles are best investigated using data that is monthly in resolution. The latest solar maximum peaked in April of 2014 and it was weaker than the previous solar maximum in 2001:

In[11]:=
monthlysunspotts = ResourceFunction[
  "SpaceWeatherData", ResourceSystemBase -> "https://www.wolframcloud.com/obj/resourcesystem/api/1.0"][{DateObject[{1997}], DateObject[{2020}]}, "MonthlySunspotNumber"]
Out[11]=
In[12]:=
DateListPlot[monthlysunspotts, FrameLabel -> {None, Automatic}]
Out[12]=

Daily sunspot numbers, especially near solar minimum, are not very impressive and sometimes are 0:

In[13]:=
dailysunspotts1 = ResourceFunction[
  "SpaceWeatherData", ResourceSystemBase -> "https://www.wolframcloud.com/obj/resourcesystem/api/1.0"][{DateObject[{2019, 1, 1}], DateObject[{2019, 4, 3}]}, "DailySunspotNumber"]
Out[13]=
In[14]:=
DateListPlot[dailysunspotts1, FrameLabel -> {None, Automatic}]
Out[14]=

During a solar maximum, the sunspot number can become much higher:

In[15]:=
dailysunspotts2 = ResourceFunction[
  "SpaceWeatherData", ResourceSystemBase -> "https://www.wolframcloud.com/obj/resourcesystem/api/1.0"][{DateObject[{2001, 3, 15}], DateObject[{2001, 4, 15}]}, "DailySunspotNumber"]
Out[15]=
In[16]:=
DateListPlot[dailysunspotts2, FrameLabel -> {None, Automatic}]
Out[16]=

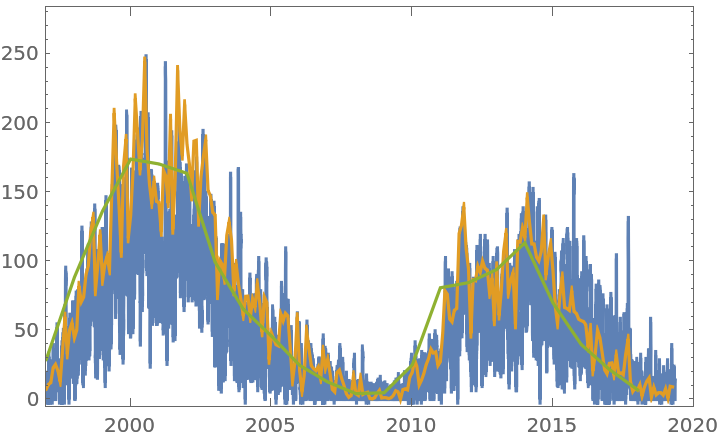
You can overlay the daily, monthly and yearly averaged data:

In[17]:=
dailysunspotts3 = ResourceFunction[
  "SpaceWeatherData", ResourceSystemBase -> "https://www.wolframcloud.com/obj/resourcesystem/api/1.0"][{DateObject[{1997}], DateObject[{2020}]}, "DailySunspotNumber"]
Out[17]=
In[18]:=
DateListPlot[{dailysunspotts3, monthlysunspotts, annualsunspotts}, FrameLabel -> {None, Automatic}, PlotRange -> {{{1997}, {2020}}, All}]
Out[18]=

Solar x-rays and solar flares (3) 

Solar flares are often the source of much of the interesting space weather effects observed on Earth. These are high-energy events, usually best observed in x‐rays. There are different bands of x‐rays that are available; the shorter wavelength band runs from.05 to.4 nm and the longer wavelength band runs from.1 to.8 nm (note: the bands overlap each other in wavelength range).

Find the current solar x-ray flux values:

In[19]:=
ResourceFunction[
 "SpaceWeatherData", ResourceSystemBase -> "https://www.wolframcloud.com/obj/resourcesystem/api/1.0"][{"ShortSolarXRayFlux", "LongSolarXRayFlux"}]
Out[19]=

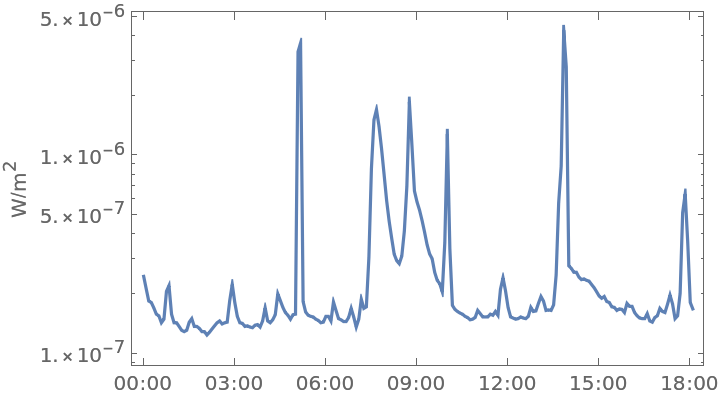
Plot the current day's long solar x-ray flux over time:

In[20]:=
xraylongts = ResourceFunction[
  "SpaceWeatherData", ResourceSystemBase -> "https://www.wolframcloud.com/obj/resourcesystem/api/1.0"][Today, "LongSolarXRayFlux"]
Out[20]=
In[21]:=
DateListLogPlot[xraylongts, FrameLabel -> {None, Automatic}]
Out[21]=

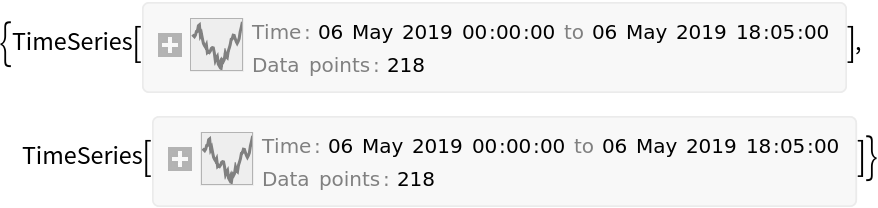
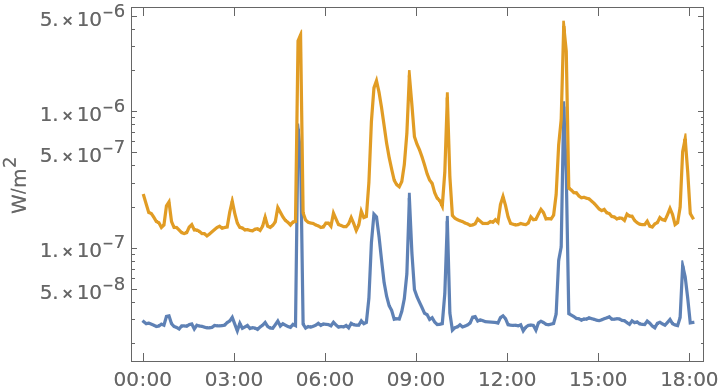
Plot the current day's long and short solar x-ray fluxes for comparison:

In[22]:=
xrayts = ResourceFunction[
  "SpaceWeatherData", ResourceSystemBase -> "https://www.wolframcloud.com/obj/resourcesystem/api/1.0"][
  Today, {"ShortSolarXRayFlux", "LongSolarXRayFlux"}]
Out[22]=
In[23]:=
DateListLogPlot[xrayts, FrameLabel -> {None, Automatic}]
Out[23]=

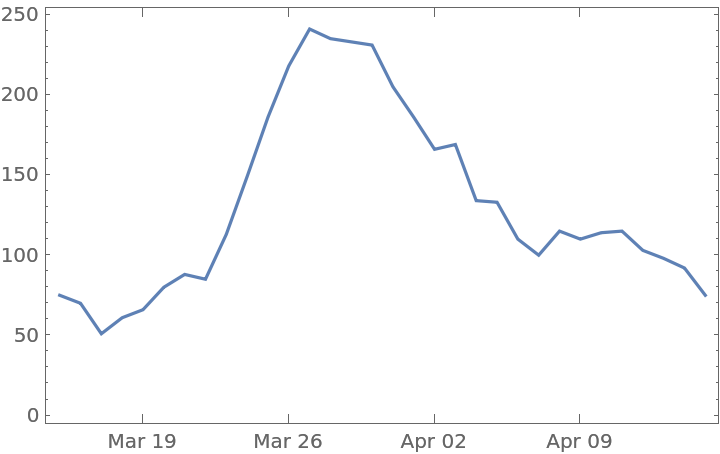
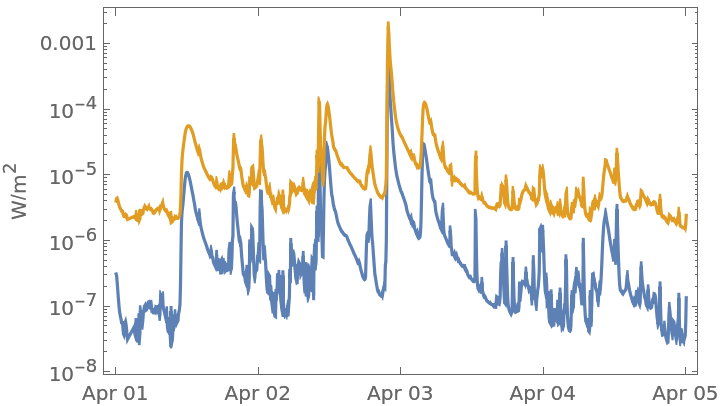
The largest solar flare recorded at the time of writing happened in early April 2001:

In[24]:=
xraymaxts = ResourceFunction[
  "SpaceWeatherData", ResourceSystemBase -> "https://www.wolframcloud.com/obj/resourcesystem/api/1.0"][{DateObject[{2001, 4, 1}], DateObject[{2001, 4, 5}]}, {"ShortSolarXRayFlux", "LongSolarXRayFlux"}]
Out[24]=
In[25]:=
DateListLogPlot[xraymaxts, FrameLabel -> {None, Automatic}]
Out[25]=

Solar wind (4) 

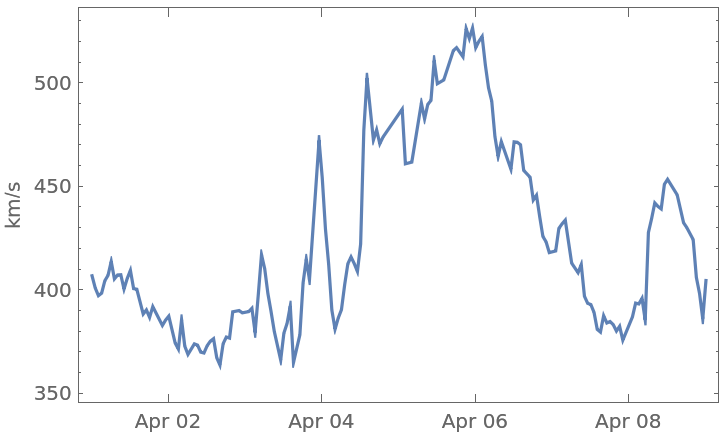
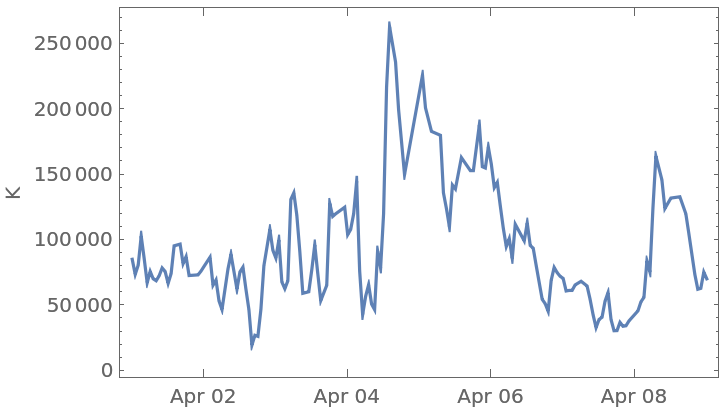
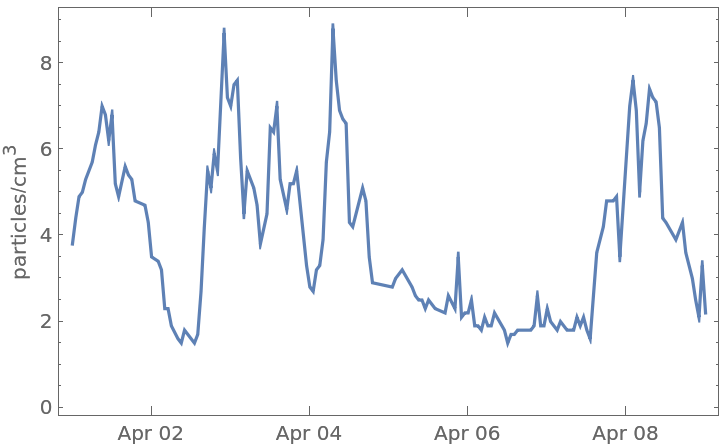
The solar wind is a stream of charged particles that come from the outer atmosphere of the Sun. The speed, temperature and density of this flow of particles change with time due to interactions with the Sun's magnetic field.

Get the current values of the solar wind speed, temperature and proton flux:

In[26]:=
ResourceFunction[
 "SpaceWeatherData", ResourceSystemBase -> "https://www.wolframcloud.com/obj/resourcesystem/api/1.0"][{"SolarWindBulkSpeed", "SolarWindIonTemperature", "SolarWindProtonDensity"}]
Out[26]=

Plot the solar wind speed over a range of several days:

In[27]:=
windts = ResourceFunction[
  "SpaceWeatherData", ResourceSystemBase -> "https://www.wolframcloud.com/obj/resourcesystem/api/1.0"][{DateObject[{2019, 4, 1}], DateObject[{2019, 4, 9}]}, "SolarWindBulkSpeed"]
Out[27]=
In[28]:=
DateListPlot[windts, FrameLabel -> {None, Automatic}]
Out[28]=

Plot the solar wind temperature over a range of several days:

In[29]:=
tempts = ResourceFunction[
  "SpaceWeatherData", ResourceSystemBase -> "https://www.wolframcloud.com/obj/resourcesystem/api/1.0"][{DateObject[{2019, 4, 1}], DateObject[{2019, 4, 9}]}, "SolarWindIonTemperature"]
Out[29]=
In[30]:=
DateListPlot[tempts, FrameLabel -> {None, Automatic}]
Out[30]=

Plot the solar wind proton density over a range of several days:

In[31]:=
protonts = ResourceFunction[
  "SpaceWeatherData", ResourceSystemBase -> "https://www.wolframcloud.com/obj/resourcesystem/api/1.0"][{DateObject[{2019, 4, 1}], DateObject[{2019, 4, 9}]}, "SolarWindProtonDensity"]
Out[31]=
In[32]:=
DateListPlot[protonts, FrameLabel -> {None, Automatic}]
Out[32]=

Interplanetary magnetic field (2) 

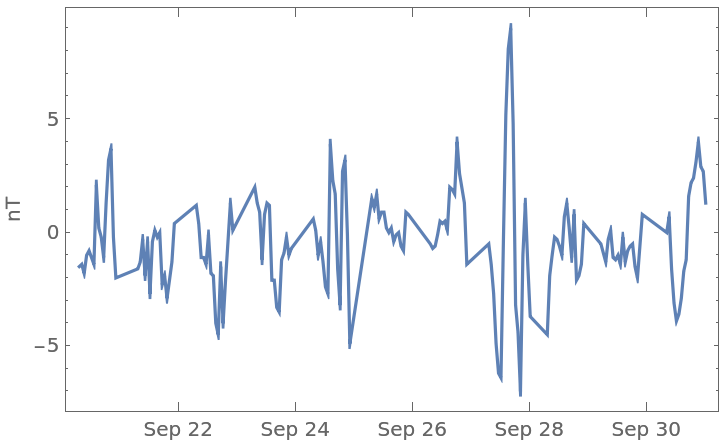
The Interplanetary Magnetic Field (IMF) is the extension of the solar magnetic field measured away from the Sun, among the planets. The point where the IMF meets the Earth's magnetic field is called the magnetopause. At the magnetopause, the z-component of the Earth's magnetic field points north. If the z-component of the IMF points strongly south (i.e. negative), then this partially cancels out the Earth's protective magnetic field and allows more solar plasma to come through and potentially interact with the Earth's atmosphere, causing auroras.

The coordinate system used for measuring the Interplanetary Magnetic Field is called the geocentric solar ecliptic system (GSE), defined here. The GSE has its x-axis pointing from the Earth toward the Sun and its y-axis is chosen to be in the ecliptic plane pointing to the Earth's west (thus opposing planetary motion). Its z-axis is parallel to the ecliptic pole. Relative to an inertial system, this system rotates once per year as the Earth circles the Sun.

Find the current IMF magnitude and components:

In[33]:=
ResourceFunction[
 "SpaceWeatherData", ResourceSystemBase -> "https://www.wolframcloud.com/obj/resourcesystem/api/1.0"][{"IMFBMagnitude", "IMFBx", "IMFBy", "IMFBz"}]
Out[33]=

Plot the z-component of the IMF over a range of several days:

In[34]:=
bzts = ResourceFunction[
  "SpaceWeatherData", ResourceSystemBase -> "https://www.wolframcloud.com/obj/resourcesystem/api/1.0"][{DateObject[{2017, 9, 20}], DateObject[{2017, 10, 1}]}, "IMFBz"]
Out[34]=
In[35]:=
DateListPlot[bzts, FrameLabel -> {None, Automatic}]
Out[35]=

Planetary K-index (2) 

The planetary K‐index, which measures the strength of a geomagnetic storm, is a coarse parameter measured every three hours or so. The higher the value, the more likely it is to see an aurora at lower latitudes. For the northern hemisphere, typically a value of 7 is the minimum needed to see an aurora as far south as Chicago.

Find the current planetary K-index value:

In[36]:=
ResourceFunction[
 "SpaceWeatherData", ResourceSystemBase -> "https://www.wolframcloud.com/obj/resourcesystem/api/1.0"]["PlanetaryKIndex"]
Out[36]=

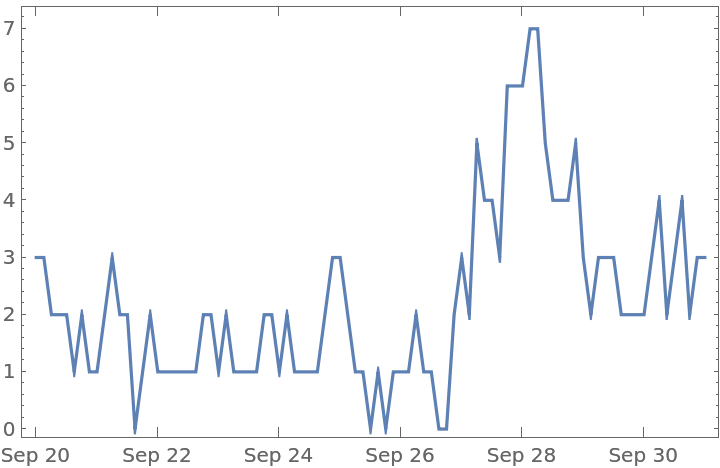
Plot the planetary K-index over a range of several days:

In[37]:=
kindexts = TimeSeries[
  ResourceFunction[
   "SpaceWeatherData", ResourceSystemBase -> "https://www.wolframcloud.com/obj/resourcesystem/api/1.0"][{DateObject[{2017, 9, 20}], DateObject[{2017, 10, 1}]}, "PlanetaryKIndex"], ResamplingMethod -> {"Interpolation", InterpolationOrder -> 0}]
Out[37]=
In[38]:=
DateListPlot[kindexts, FrameLabel -> {None, Automatic}]
Out[38]=

Solar radio flux (2) 

Radio flux from the Sun measured at a wavelength of 10.7 cm can be used as a general indicator of solar activity. Radio waves at this wavelength are generated at the boundary between the chromosphere and corona of the Sun. The flux correlates well with a number of other solar activity indicators.

Find the current solar 10.7cm radio flux:

In[39]:=
ResourceFunction[
 "SpaceWeatherData", ResourceSystemBase -> "https://www.wolframcloud.com/obj/resourcesystem/api/1.0"]["TenDotSevenCMSolarRadioFlux"]
Out[39]=

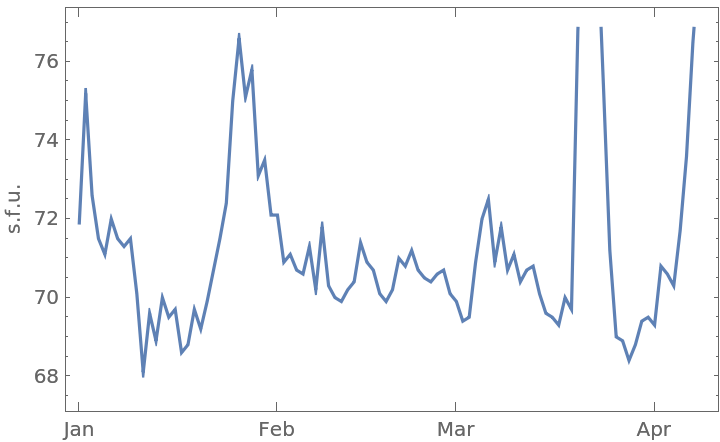
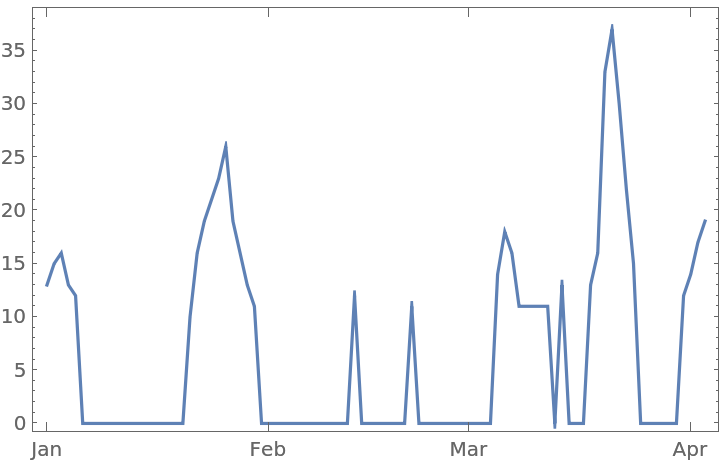
Plot the planetary K-index over a range of four months:

In[40]:=
radiots = ResourceFunction[
  "SpaceWeatherData", ResourceSystemBase -> "https://www.wolframcloud.com/obj/resourcesystem/api/1.0"][{DateObject[{2019, 1, 1}], DateObject[{2019, 4, 9}]}, "TenDotSevenCMSolarRadioFlux"]
Out[40]=
In[41]:=
DateListPlot[radiots, FrameLabel -> {None, Automatic}]
Out[41]=

Possible Issues (2) 

Some properties have a very high time resolution, so if a large date range is requested, the query may time out:

In[42]:=
ResourceFunction[
 "SpaceWeatherData", ResourceSystemBase -> "https://www.wolframcloud.com/obj/resourcesystem/api/1.0"][{DateObject[{2001, 4, 1}], DateObject[{2019, 4, 10}]}, "ShortSolarXRayFlux"]
Out[42]=

To avoid this issue, keep the time range narrower:

In[43]:=
ResourceFunction[
 "SpaceWeatherData", ResourceSystemBase -> "https://www.wolframcloud.com/obj/resourcesystem/api/1.0"][{DateObject[{2019, 4, 1}], DateObject[{2019, 4, 10}]}, "ShortSolarXRayFlux"]
Out[43]=

Version History

  • 3.1.0 – 26 July 2023
  • 3.0.0 – 30 September 2020
  • 2.0.0 – 18 October 2019
  • 1.0.0 – 10 May 2019

Related Resources

License Information