Wolfram Function Repository
Instant-use add-on functions for the Wolfram Language
Function Repository Resource:
Obtain data from a seismographic station for a given date range
ResourceFunction["SeismographData"][] lists all supported seismographic clients. | |
ResourceFunction["SeismographData"][client] lists all supported networks and stations for the given client. | |
ResourceFunction["SeismographData"][client,network] lists all supported stations for the given client and network. | |
ResourceFunction["SeismographData"][client,network,station,location,channel,{start,end}] gives seismographic data for the given parameters. | |
ResourceFunction["SeismographData"][client,network,station,{start,end}] gives seismographic data for the given parameters, for any location and channel. |
List all supported seismographic clients:
| In[1]:= |
| Out[1]= |  |
Get a full list of networks and stations provided by the IRIS client (this may take a long time):
| In[2]:= |
| Out[2]= | 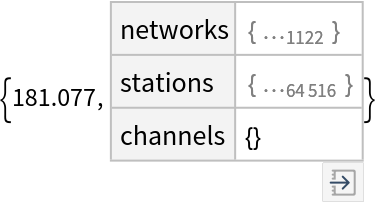 |
Get all stations for the "IU" network:
| In[3]:= |
| Out[3]= | 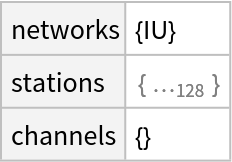 |
Get information for a specific station:
| In[4]:= |
| Out[4]= | 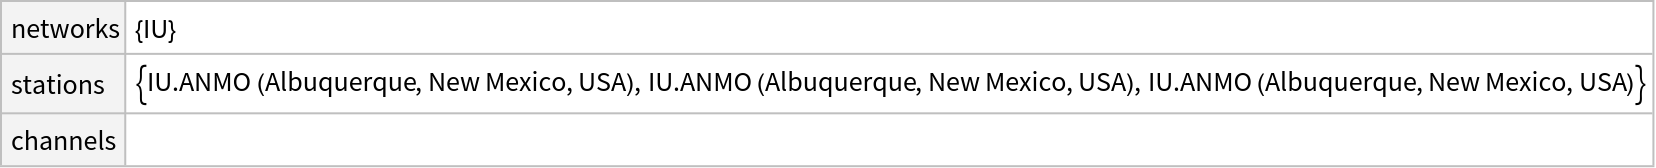 |
Get all seismographic information for the Albuquerque station for the given date range and any location and channel:
| In[5]:= | ![timeseries = ResourceFunction["SeismographData"]["IRIS", "IU", "ANMO", "*", "*", {DateObject[{2010, 2, 27, 6, 45, 0}, "Instant", "Gregorian", "UTC"], DateObject[{2010, 2, 27, 7, 45, 0}, "Instant", "Gregorian", "UTC"]}];](https://www.wolframcloud.com/obj/resourcesystem/images/5a3/5a388654-4b72-4f06-a718-6c68791c193e/759cc4086c31f250.png) |
Plot the first three of the seismographic timeseries:
| In[6]:= |
| Out[6]= |  |
You can also omit the "*" wildcards for location and channel:
| In[7]:= | ![timeseries = ResourceFunction["SeismographData"]["IRIS", "IU", "ANMO", {DateObject[{2010, 2, 27, 6, 45, 0}, "Instant", "Gregorian", "UTC"], DateObject[{2010, 2, 27, 7, 45, 0}, "Instant", "Gregorian", "UTC"]}];](https://www.wolframcloud.com/obj/resourcesystem/images/5a3/5a388654-4b72-4f06-a718-6c68791c193e/0aea44dc61dff63e.png) |
| In[8]:= |
| Out[8]= | 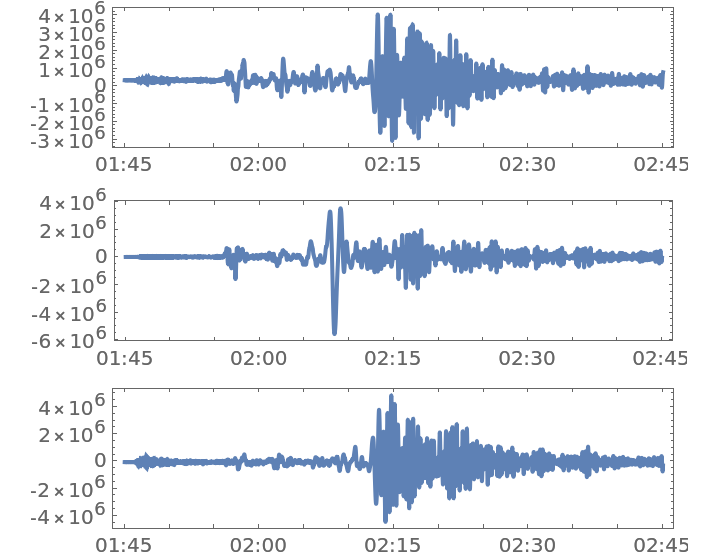 |
Wolfram Language 14.0 (January 2024) or above
This work is licensed under a Creative Commons Attribution 4.0 International License