Wolfram Function Repository
Instant-use add-on functions for the Wolfram Language
Function Repository Resource:
Perform interpolation in n-dimensional space for irregularly spaced data
ResourceFunction["ScatteredInterpolation"][{pts1→v1,pts2→v2,…},{x1,x2,…}] interpolates values at xi assuming the function take values vi at points ptsi. | |
ResourceFunction["ScatteredInterpolation"][{pts1→v1,pts2→v2,…},{x1,x2,…},p] uses the power parameter p for the weighting. | |
ResourceFunction["ScatteredInterpolation"][{pts1→v1,pts2→v2,…},{x1,x2,…},p,nbspec] uses the neighborhood specification nbspec. | |
ResourceFunction["ScatteredInterpolation"][{{{x1,y1},v1},{{x2,y2},v2},…},…] interpolates data given as position-value pairs. | |
ResourceFunction["ScatteredInterpolation"][{pts1→v1,pts2→v2,…},p,nbspec] represents an operator form that can be applied to the points {x1,x2,…}. |
Find scattered interpolations of a few points in 1D:
| In[1]:= |
| Out[1]= |
Interpolate in 1D:
| In[2]:= | ![ref = {4.8899913499492556` -> 0.9031326446751295`, 1.392792312302646` -> 0.8452211334302036`, 3.7329747819370276` -> 0.7506691817125113`, 3.6344473306632317` -> 0.5609777119243873`, 4.502776333137257` -> 0.2861928835103029`, 9.308025498446717` -> 0.8910605626408117`, 1.6139856617732704` -> 0.5113662122131557`, 1.887782604676982` -> 0.7338499915592447`, 3.0719573664861617` -> 0.8498335301543973`, 3.230905136858455` -> 0.6202210246844337`, 4.684791130057821` -> 0.6993738414887227`, 6.442677446169533` -> 0.6045567909822067`, 6.10605611091858` -> 0.23505337764021728`, 5.006465834341876` -> 0.06849979808894058`, 9.959154534492047` -> 0.6370358021750766`};
Short[out = ResourceFunction["ScatteredInterpolation"][ref, Subdivide[0, 10, 300]]]](https://www.wolframcloud.com/obj/resourcesystem/images/8f7/8f7e1bcd-f8cf-4de7-9598-389f6861e478/07a553b6ef267ce5.png) |
| Out[3]= |
Show the results along with the original points:
| In[4]:= |
| Out[4]= |  |
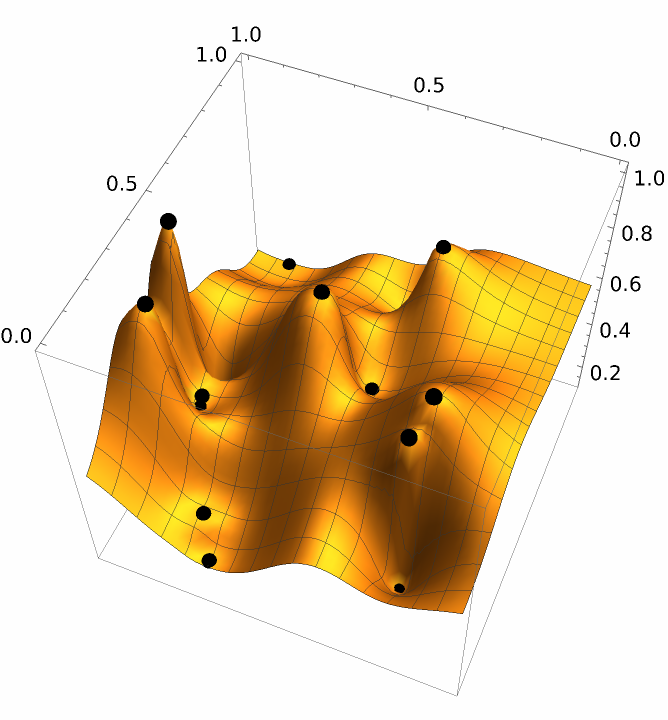
Interpolate in 2D:
| In[5]:= | ![SeedRandom[1337];
tmp = Table[RandomPoint[Rectangle[]] -> RandomReal[], 15];
xs = Catenate@Table[{i, j}, {i, Subdivide[50]}, {j, Subdivide[50]}];
Short[out = ResourceFunction["ScatteredInterpolation"][tmp, xs, 3, All]]](https://www.wolframcloud.com/obj/resourcesystem/images/8f7/8f7e1bcd-f8cf-4de7-9598-389f6861e478/7fa52947d702e6d7.png) |
| Out[8]= |
Plot the resulting surface along with the original points:
| In[9]:= |
| Out[9]= |  |
Interpolate 5D scattered data:
| In[10]:= | ![SeedRandom[1337];
tmp = Table[RandomReal[{0, 1}, 5] -> RandomReal[], 15];
xs = {ConstantArray[0.5, 5]};
ResourceFunction["ScatteredInterpolation"][tmp, xs, 3, All]](https://www.wolframcloud.com/obj/resourcesystem/images/8f7/8f7e1bcd-f8cf-4de7-9598-389f6861e478/676c635c1e497dc7.png) |
| Out[13]= |
Alternatively it can be specified in an operator form:
| In[14]:= |
| Out[14]= |
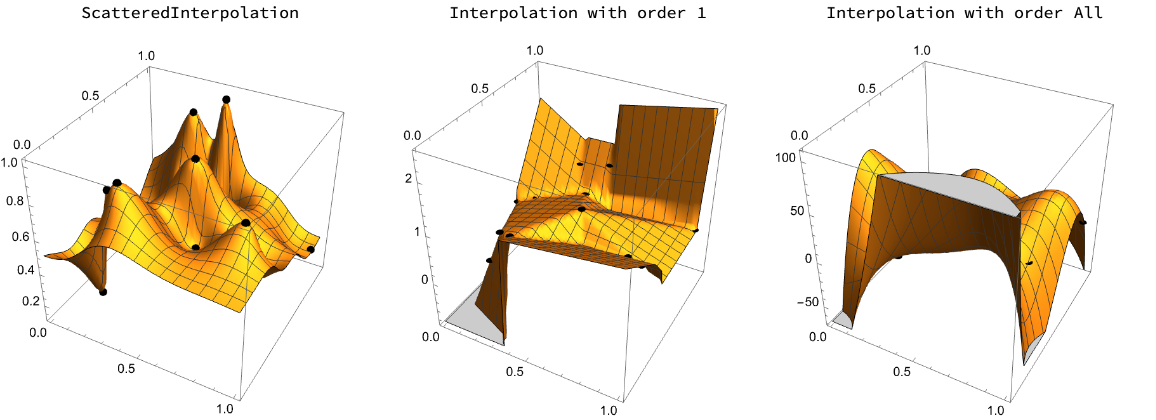
The built-in Interpolation function cannot recreate the results from ScatteredInterpolation:
| In[20]:= | ![SeedRandom[1337];
tmp = Table[RandomPoint[Rectangle[]] -> RandomReal[], 15];
xs = Catenate@Table[{i, j}, {i, Subdivide[50]}, {j, Subdivide[50]}];
out = ResourceFunction["ScatteredInterpolation"][tmp, xs, 3, All];
a = Show[{ListPlot3D[Flatten /@ out], Graphics3D[{Black, Sphere[Append @@@ tmp, 0.02]}]}, BoxRatios -> Automatic, ImageSize -> 300];
dt = Quiet[{#, Interpolation[List @@@ tmp, InterpolationOrder -> 1] @@ #} & /@ xs];
b = Show[{ListPlot3D[Flatten /@ dt], Graphics3D[{Black, Sphere[Append @@@ tmp, 0.02]}]}, BoxRatios -> {1, 1, 1}, ImageSize -> 300];
dt = Quiet[{#, Interpolation[List @@@ tmp, InterpolationOrder -> All] @@ #} & /@
xs];
c = Show[{ListPlot3D[Flatten /@ dt], Graphics3D[{Black, Sphere[Append @@@ tmp, 0.02]}]}, BoxRatios -> {1, 1, 1}, ImageSize -> 300];
Grid[{{"ScatteredInterpolation", "Interpolation with order 1", "Interpolation with order All"}, {a, b, c}}]](https://www.wolframcloud.com/obj/resourcesystem/images/8f7/8f7e1bcd-f8cf-4de7-9598-389f6861e478/2d877abff7569451.png) |
| Out[29]= |  |
If a specific radius is given, large gaps in the data might prevent the possibility of interpolation; moreover the function can be discontinuous in some places:
| In[30]:= | ![ref = {4.8899913499492556` -> 0.9031326446751295, 1.392792312302646 -> 0.8452211334302036, 3.7329747819370276` -> 0.7506691817125113, 3.6344473306632317` -> 0.5609777119243873, 4.502776333137257 -> 0.2861928835103029, 9.308025498446717 -> 0.8910605626408117, 1.6139856617732704` -> 0.5113662122131557, 1.887782604676982 -> 0.7338499915592447, 3.0719573664861617` -> 0.8498335301543973, 3.230905136858455 -> 0.6202210246844337, 4.684791130057821 -> 0.6993738414887227, 6.442677446169533 -> 0.6045567909822067, 6.10605611091858 -> 0.23505337764021728`, 5.006465834341876 -> 0.06849979808894058, 9.959154534492047 -> 0.6370358021750766};
out = ResourceFunction["ScatteredInterpolation"][ref, Subdivide[0, 10, 300], 4, {All, 0.7}];
ListLinePlot[out, AspectRatio -> 1/4, Epilog -> {PointSize[0.01], Point[List @@@ ref]}, ImageSize -> 800]](https://www.wolframcloud.com/obj/resourcesystem/images/8f7/8f7e1bcd-f8cf-4de7-9598-389f6861e478/64ac54b820fa12cb.png) |
| Out[31]= |  |
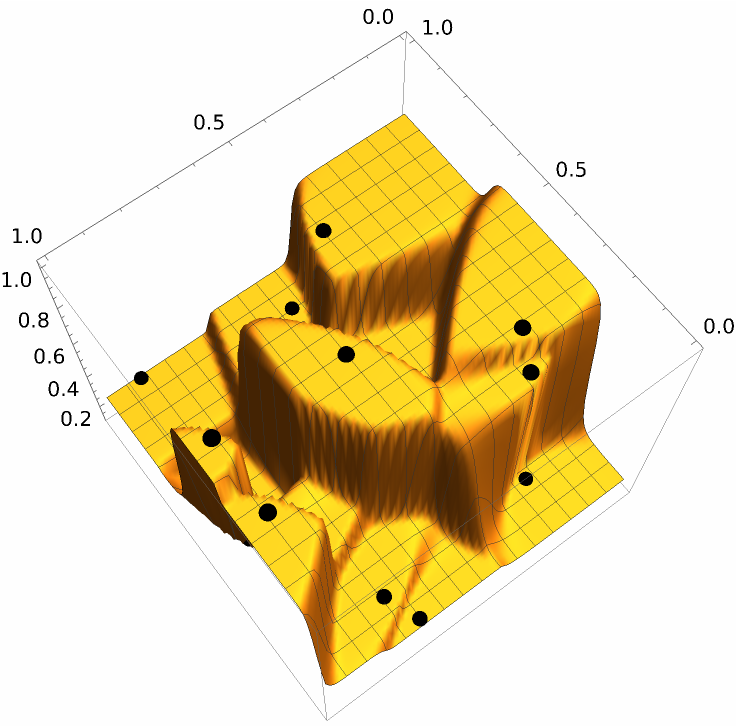
High p basically gives the value of the nearest point, creating a Voronoi tessellation:
| In[32]:= | ![SeedRandom[1337];
tmp = Table[RandomPoint[Rectangle[]] -> RandomReal[], 15];
xs = Catenate@Table[{i, j}, {i, Subdivide[80]}, {j, Subdivide[80]}];
out = ResourceFunction["ScatteredInterpolation"][tmp, xs, 30];
Show[{ListPlot3D[Flatten /@ out], Graphics3D[{Black, Sphere[Append @@@ tmp, 0.02]}]}, BoxRatios -> Automatic]](https://www.wolframcloud.com/obj/resourcesystem/images/8f7/8f7e1bcd-f8cf-4de7-9598-389f6861e478/7734550b63cd0fe6.png) |
| Out[33]= |  |
Wolfram Language 13.0 (December 2021) or above
This work is licensed under a Creative Commons Attribution 4.0 International License