Wolfram Function Repository
Instant-use add-on functions for the Wolfram Language
Function Repository Resource:
Compute the properties of a specified rose curve
ResourceFunction["RoseCurveProperties"][a,n] gives an association of properties related to the rose curve with polar formula r=aSin[n θ]. | |
ResourceFunction["RoseCurveProperties"][a,n,prop] gives the values of the specified properties in prop. | |
ResourceFunction["RoseCurveProperties"][a,n,prop,format] gives the values of the specified properties in prop as either an Association or a Dataset determined by format. |
| "Equation" | equation of the rose curve |
| "Plot" | plot of the rose curve |
| "PetalPlot" | plot of a single petal |
| "PetalCount" | number of petals |
| "PetalTotalAreaFormula" | formula for the total area of a single petal |
| "PetalTotalArea" | total area of a single petal |
| "InactiveTotalAreaIntegral" | inactive double integral for the total area of the rose curve |
| "InactiveTotalAreaSingleIntegral" | inactive single integral for the total area of the rose curve |
| "TotalAreaFormula" | formula for the total area of a rose curve (for rational n, rewrite n as the reduced fration p/q) |
| "TotalArea" | total area of the rose curve |
| "TotalAreaPlot" | plot of the rose curve where darker hues correspond to overlapped sections |
| "PetalArcLength" | arc length of a single petal |
| "ArcLength" | arc length of the rose curve over one full period |
| "IntersectionCount" | number of times the rose curve self-intersects |
| "ClosedDomain" | interval of angles where the rose curve makes a complete cycle |
| "HorizontalSymmetry" | yields True if the the curve is symmetric across the vertical axis |
| "VerticalSymmetry" | yields True if the the curve is symmetric across the horizontal axis |
| "RotationalSymmetry" | yields True if the the curve is symmetric when rotated 180° about the origin |
| "MaximumOuterCurveRadius" | largest radius value along the outer curve |
| "MinimumOuterCurveRadius" | smallest radius value along the outer curve |
| "OriginIntersectionCount" | number of times the curve passes through the origin along its closed domain |
| "SymmetryGroup" | the Dihedral symmetry group associated with the curve |
| All | all properties associated with the given value of n |
| "PetalSurfaceAreaFormula" | formula for the surface area of a single petal |
| "PetalSurfaceArea" | surface area of a single petal |
| "InactiveSurfaceAreaIntegral" | inactive double integral for the surface area of the rose curve |
| "InactiveSurfaceAreaSingleIntegral" | inactive single integral for the surface area of the rose curve |
| "SurfaceAreaFormula" | formula for the surface area of the rose curve (n is expressed as the reduced fraction p/q) |
| "SurfaceArea" | surface area of the rose curve |
| "OuterCurveEquation" | piecewise function for the outline of the rose curve |
| "OuterCurvePlot" | plot of the outline of the rose curve |
Get an Association of the relevant information for a given rose curve:
| In[1]:= |
| Out[1]= | 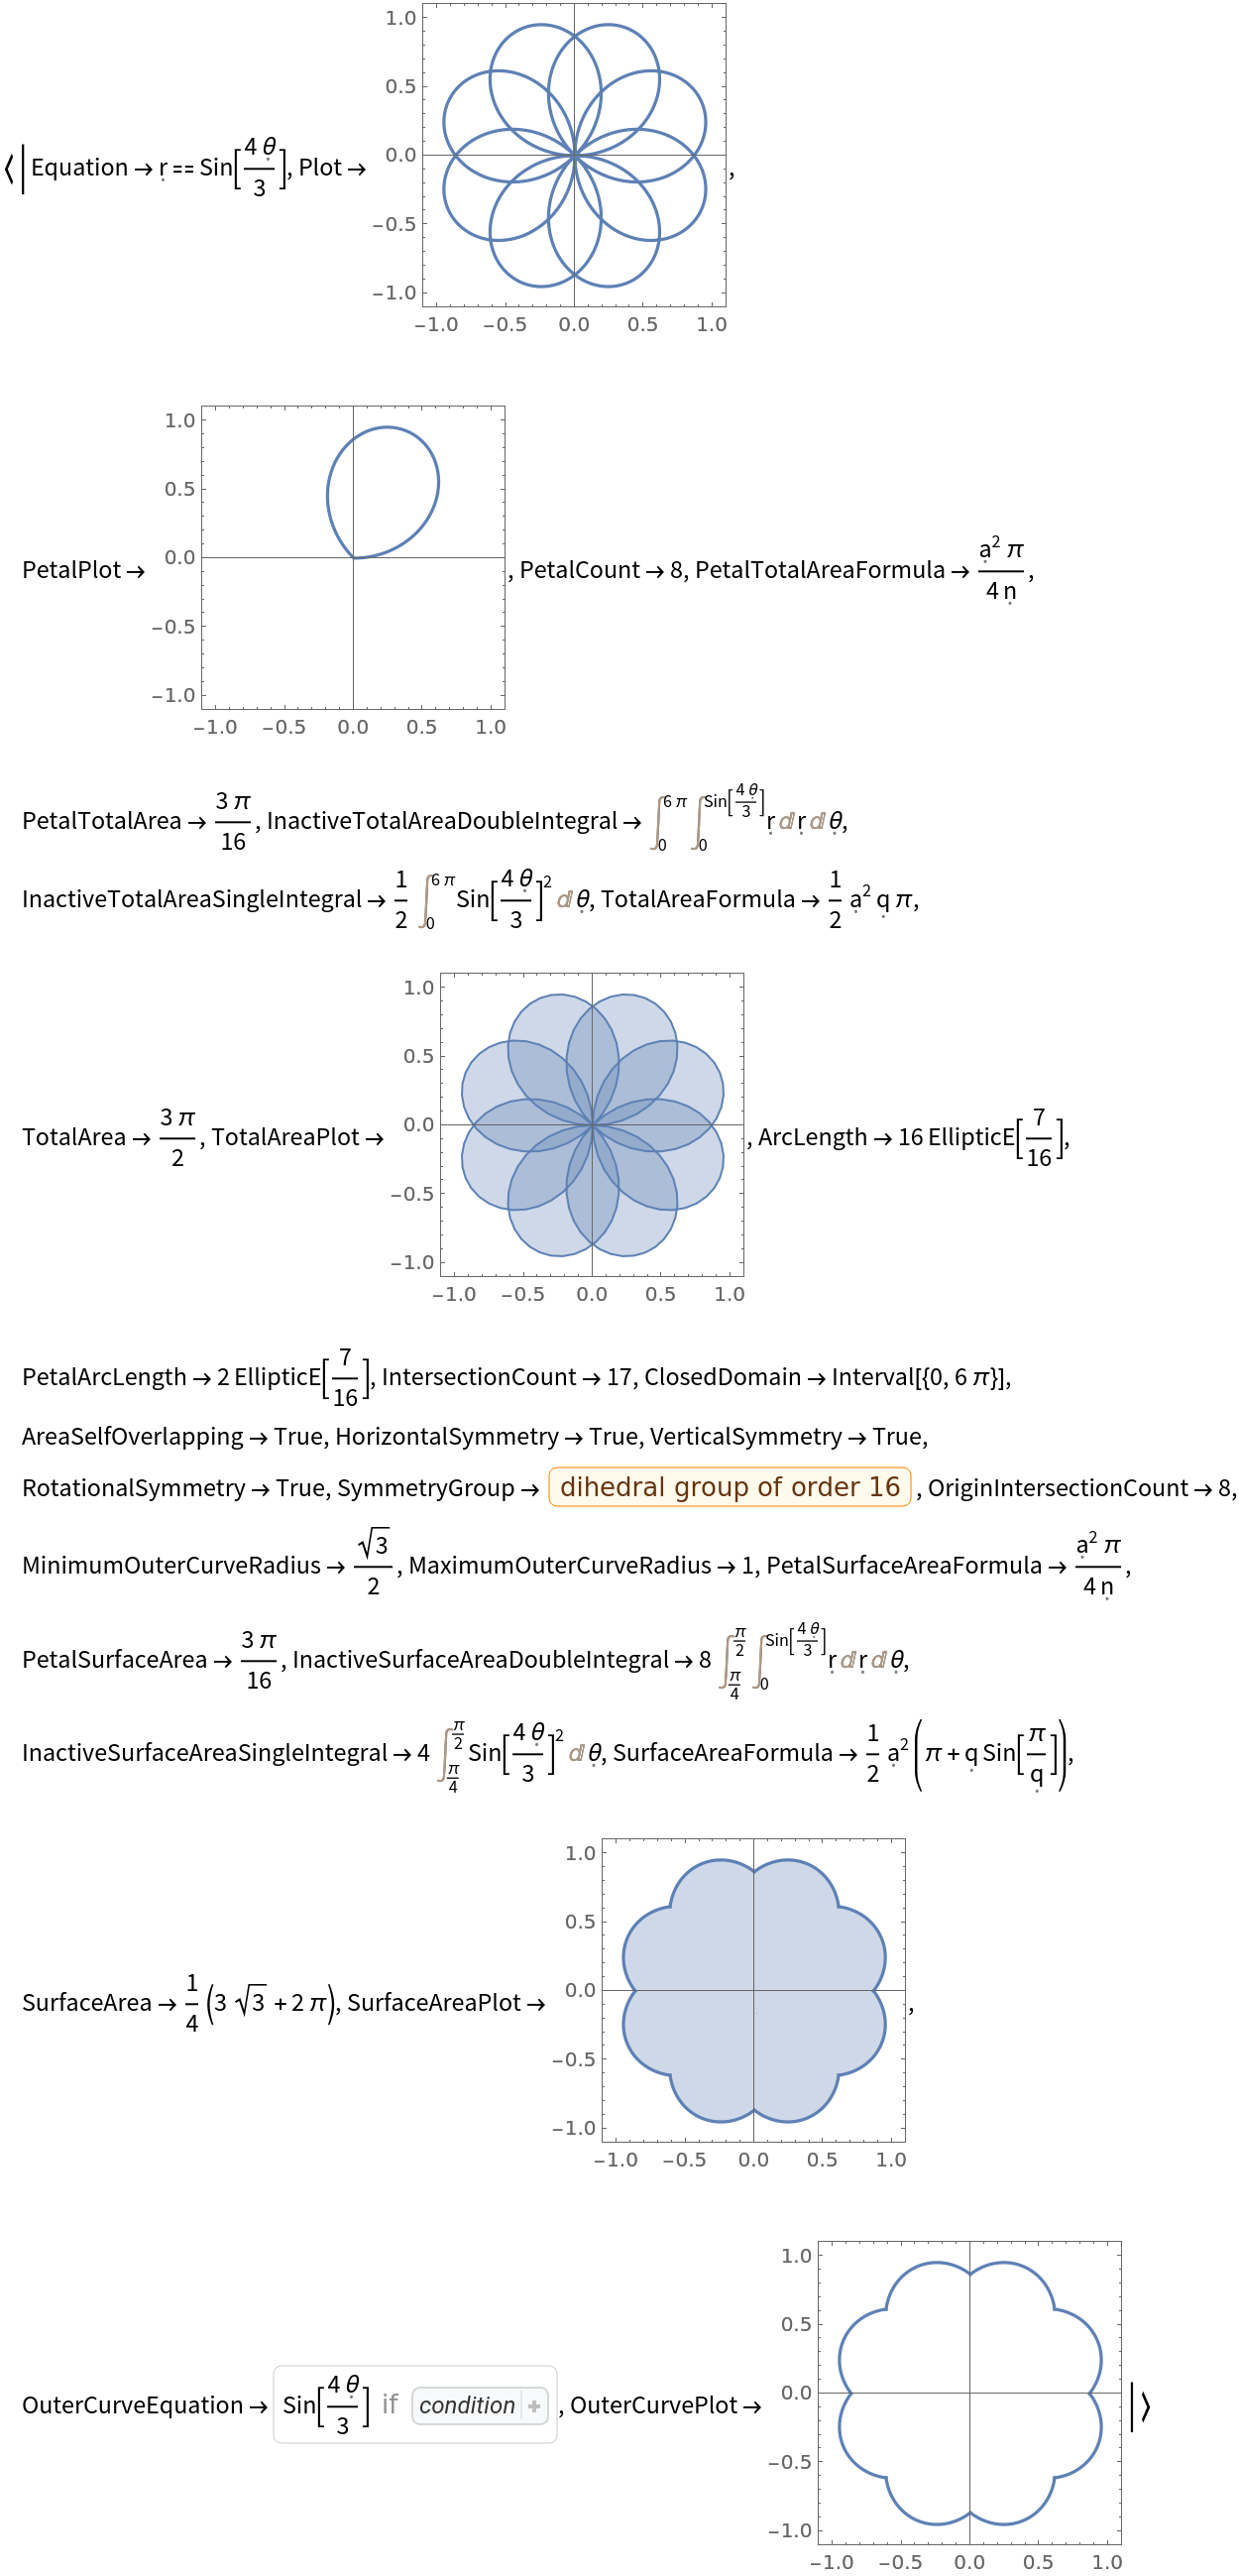 |
Get the number of petals and total area as an Association:
| In[2]:= |
| Out[2]= |
Get the same information as a Dataset:
| In[3]:= |
| Out[3]= | 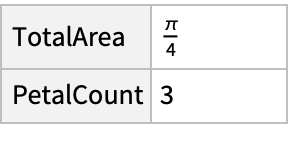 |
Find the plot of a rose curve with positive and negative values of a:
| In[4]:= |
| Out[4]= | 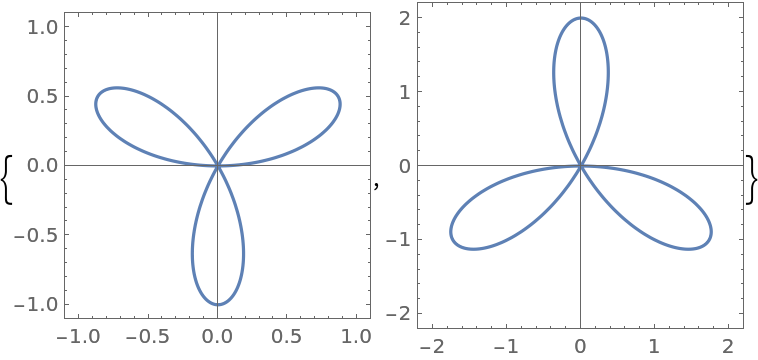 |
Decimal forms of n are acceptable and are rationalized internally to produce exact results:
| In[5]:= |
| Out[5]= | 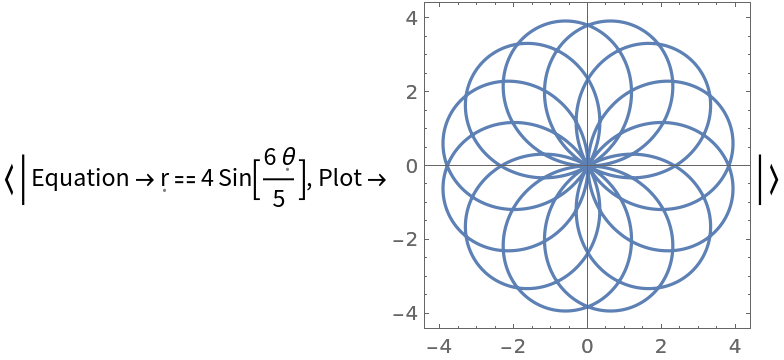 |
Default PolarPlot options can be used for "Plot", "PetalPlot", and "OuterCurvePlot":
| In[6]:= |
| Out[6]= | 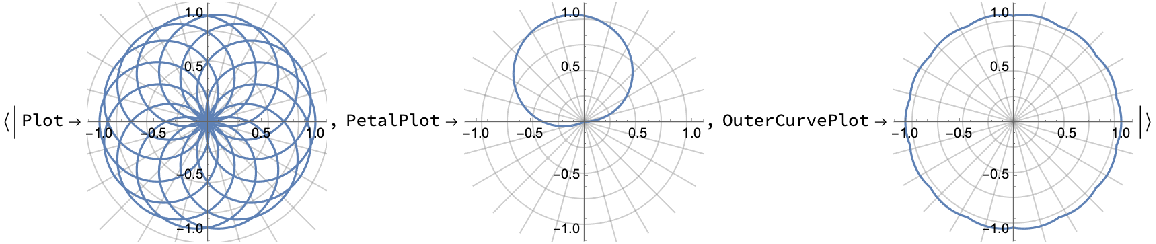 |
Default ParametricPlot options can be used for "TotalAreaPlot":
| In[7]:= |
| Out[7]= | 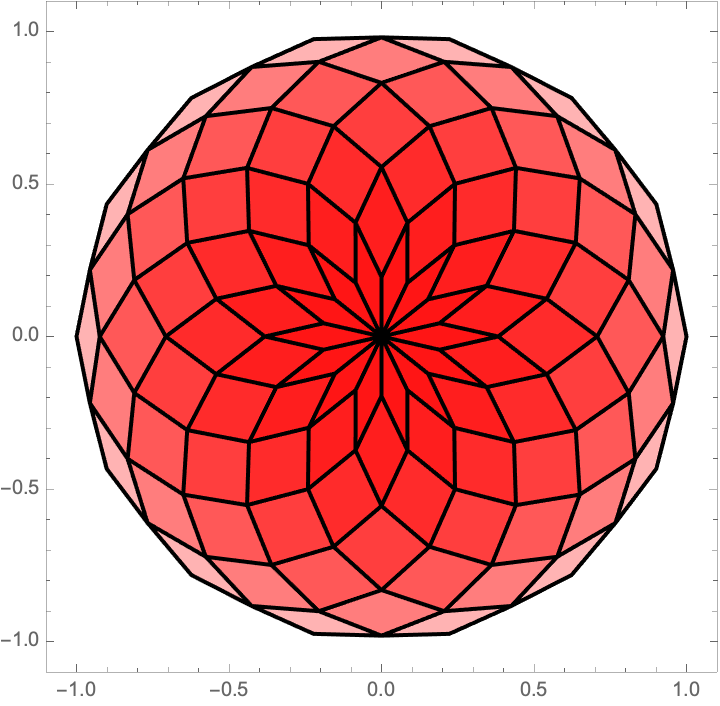 |
Depict the different rose curves for n=1/t as t increases:
| In[8]:= | ![Table[ResourceFunction["RoseCurveProperties"][1, 1/t, "Plot", ImageSize -> 50, Frame -> False, Axes -> False], {t, 1, 10}]](https://www.wolframcloud.com/obj/resourcesystem/images/bb3/bb3414dc-a2ba-41fb-a9ff-bb287773dc93/3208f685939c044a.png) |
| Out[8]= |  |
Plot the increasing and oscillating number of self-intersections (depending on the parity of t):
| In[9]:= |
| Out[9]= | 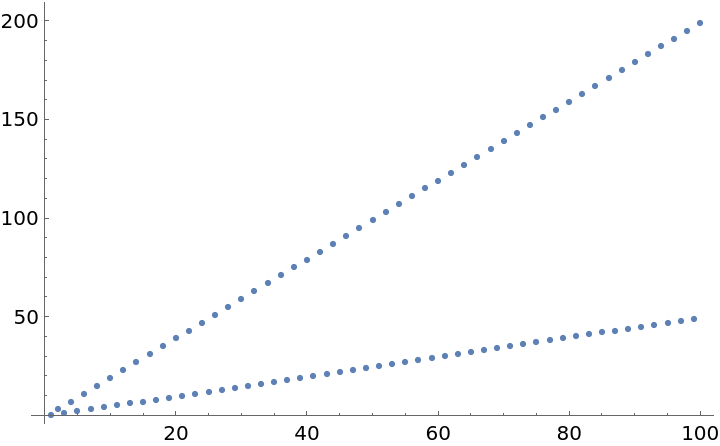 |
Show the change in outer curve plots, which visually approach a circle:
| In[10]:= | ![Table[ResourceFunction["RoseCurveProperties"][1, 1/t, "OuterCurvePlot", ImageSize -> 50, Frame -> False, Axes -> False], {t, 1, 10}]](https://www.wolframcloud.com/obj/resourcesystem/images/bb3/bb3414dc-a2ba-41fb-a9ff-bb287773dc93/5ac3f60b089f171c.png) |
| Out[10]= |  |
Plotting the surface area, the rose curve shows the progression towards π:
| In[11]:= |
| Out[11]= | 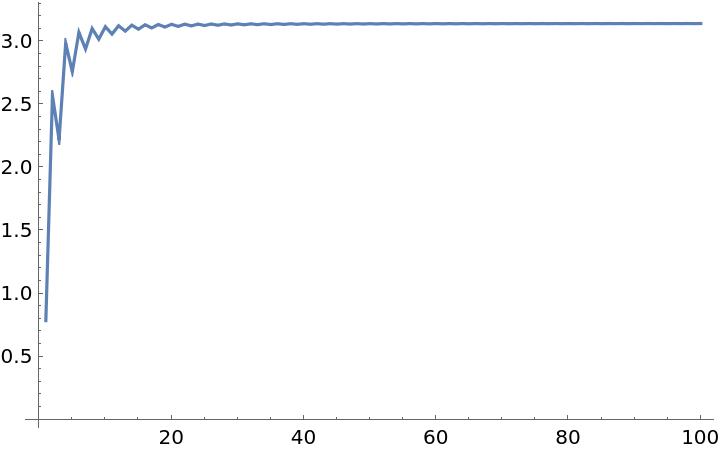 |
Plotting the rose curve and outer curve for n=1/50 explains further why the surface area approaches π:
| In[12]:= |
| Out[12]= | 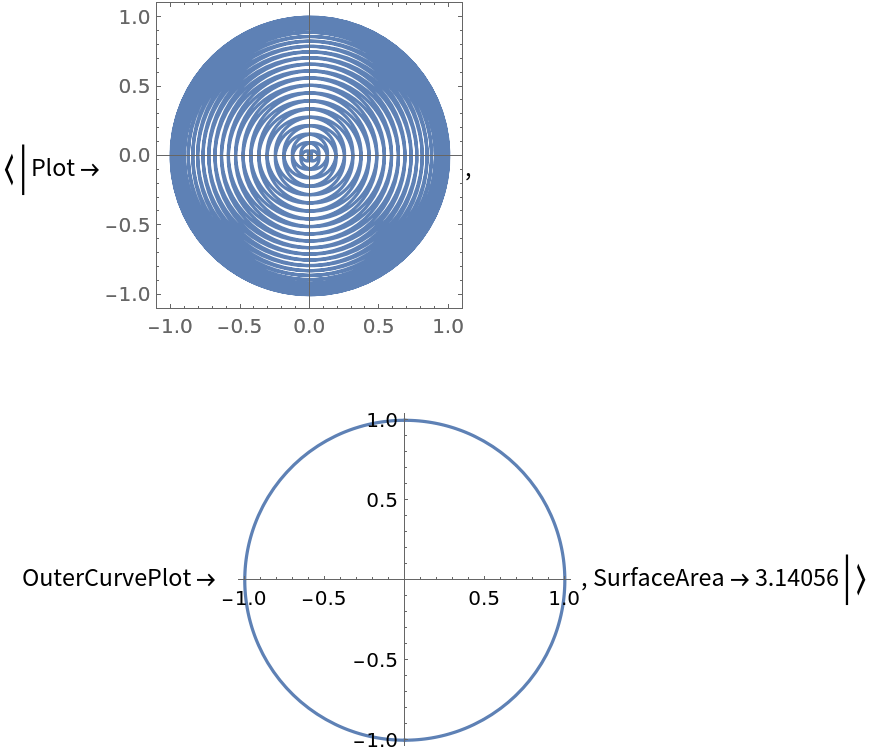 |
Show how a single petal flattens for increasing integer values of n:
| In[13]:= | ![Table[ResourceFunction["RoseCurveProperties"][1, k, "PetalPlot", ImageSize -> 50, Frame -> False, Axes -> False], {k, 1, 10}]](https://www.wolframcloud.com/obj/resourcesystem/images/bb3/bb3414dc-a2ba-41fb-a9ff-bb287773dc93/654584ed0dc54d39.png) |
| Out[13]= |  |
Plot the area of a single petal against the n value:
| In[14]:= |
| Out[14]= | 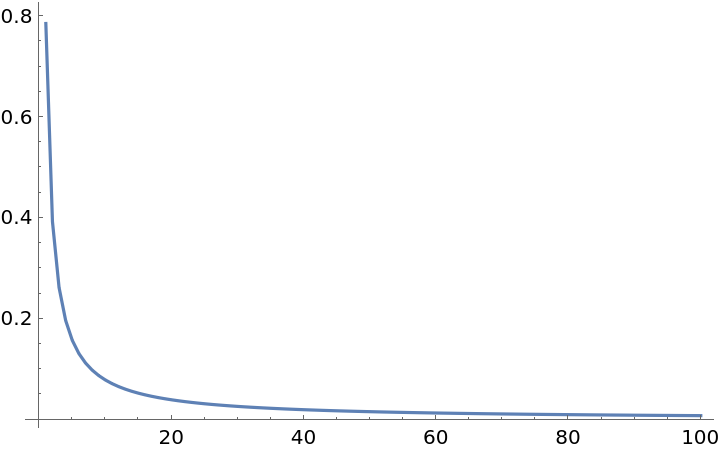 |
The above plot is explained by the "PetalTotalAreaFormula" property:
| In[15]:= |
| Out[15]= |
For the default number of PlotPoints, the area plot may appear choppy:
| In[16]:= |
| Out[16]= | 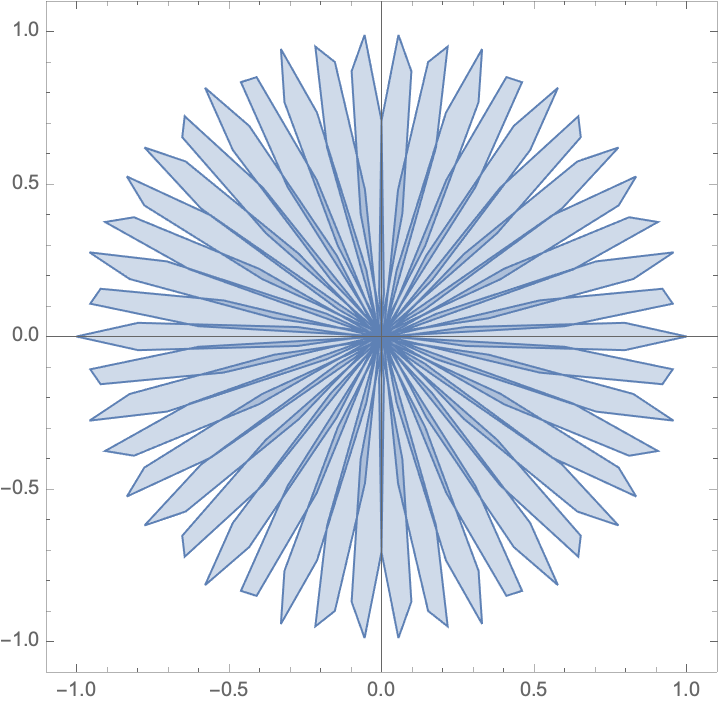 |
Adding a higher value for PlotPoints may take longer, but will produce a smoother and more accurate plot:
| In[17]:= |
| Out[17]= | 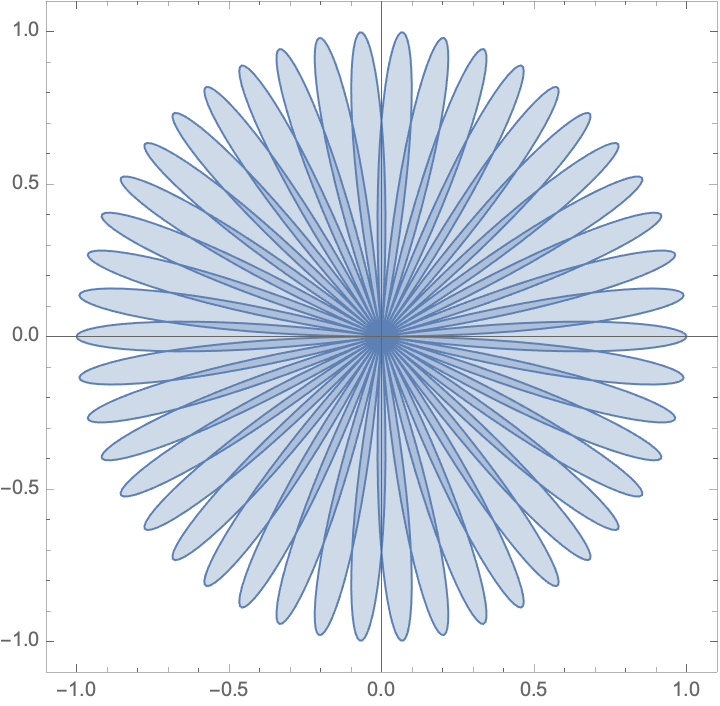 |
For non-numerical values of a, the function is left unevaluated:
| In[18]:= |
| Out[18]= |
For negative, irrational or nonnumerical values of n, the function is left unevaluated:
| In[19]:= |
| Out[19]= |
When no available property is called, the function is left unevaluated:
| In[20]:= |
| Out[20]= |
Visualize the progression of the rose curve plot for integer-valued n:
| In[21]:= |
| Out[21]= | 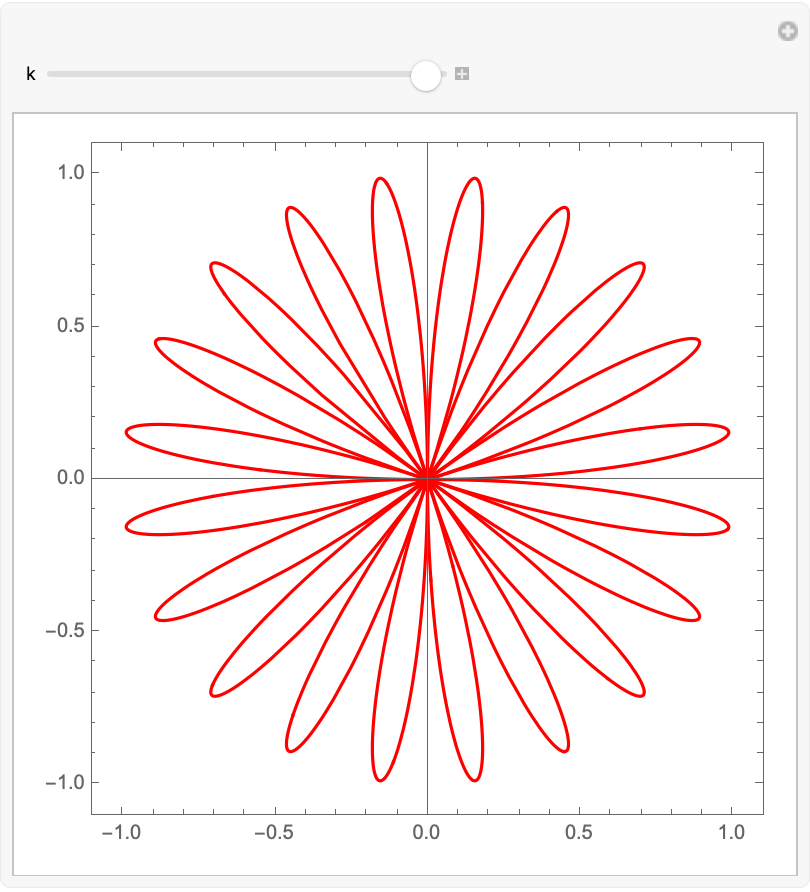 |
Plotting the first 10 rose curves for integer n on one graph:
| In[22]:= | ![Show[Table[
ResourceFunction["RoseCurveProperties"][1, k, "Plot", Axes -> False,
PlotStyle -> {Black, Opacity[1 - k/10]}], {k, 1, 10}]]](https://www.wolframcloud.com/obj/resourcesystem/images/bb3/bb3414dc-a2ba-41fb-a9ff-bb287773dc93/15c9cd4cfd227549.png) |
| Out[22]= | 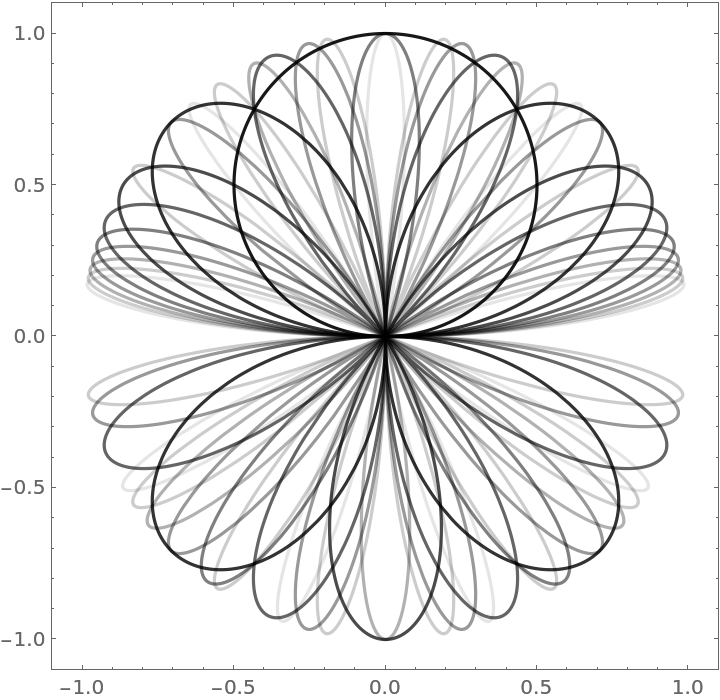 |
Plotting the first 10 rational n (with numerator 1) rose curves on one graph:
| In[23]:= | ![Show[Table[
ResourceFunction["RoseCurveProperties"][1, 1/k, "Plot", Axes -> False, PlotStyle -> {Black, Opacity[1 - k/10]}], {k, 1, 10}]]](https://www.wolframcloud.com/obj/resourcesystem/images/bb3/bb3414dc-a2ba-41fb-a9ff-bb287773dc93/608e0229aa8efda6.png) |
| Out[23]= | 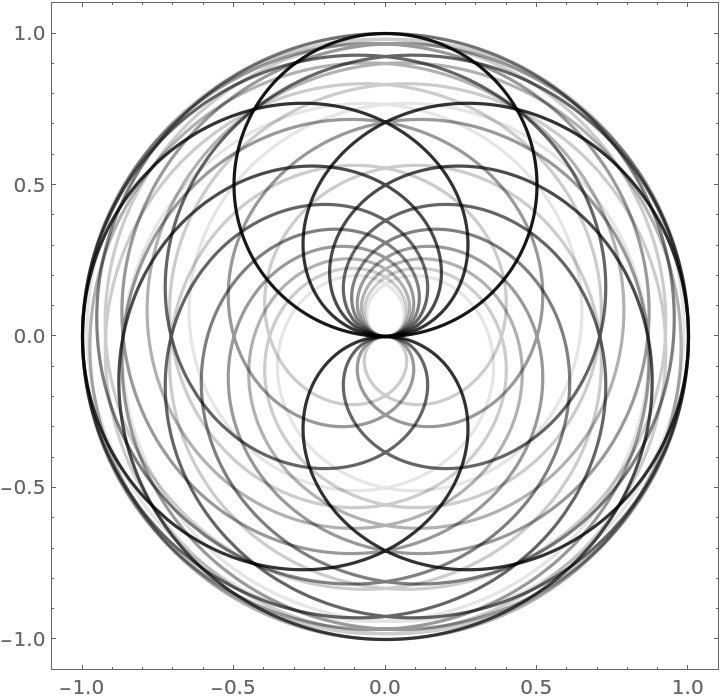 |
To view the full source code for RoseCurveProperties, evaluate the following:

This work is licensed under a Creative Commons Attribution 4.0 International License