Wolfram Function Repository
Instant-use add-on functions for the Wolfram Language
Function Repository Resource:
Generate an illustration of resistor color codes from a specified resistance
ResourceFunction["ResistorColorCode"][resistance,"ColorList"] generates a list of resistor color codes used to represent the specified resistance. | |
ResourceFunction["ResistorColorCode"][resistance,"Graphics"] generates a resistor color code illustration used to represent the specified resistance found in analog electronics. | |
ResourceFunction["ResistorColorCode"][<|"Resistance"→resistance,"Tolerance"→tolerance|>,prop] uses the specified resistance and tolerance. |
Generate a list of colors corresponding to a resistor color code for a given resistance:
| In[1]:= |
| Out[1]= |
Display a graphical representation of the resistor:
| In[2]:= |
| Out[2]= |  |
Generate a pair of images when there are two equivalent color code representations:
| In[3]:= |
| Out[3]= | 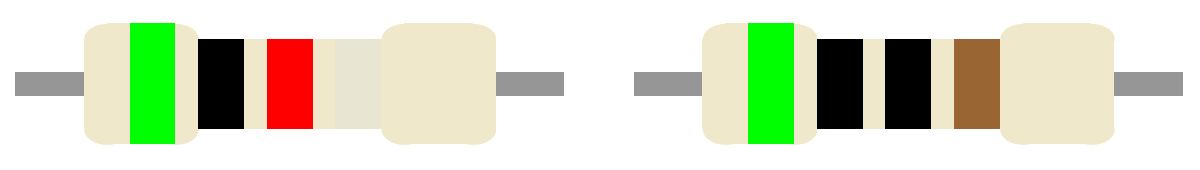 |
Generate a pair of color lists instead of graphics:
| In[4]:= |
| Out[4]= |
The final stripe represents the tolerance value:
| In[5]:= |
| Out[5]= |  |
| In[6]:= |
| Out[6]= |
Generate color lists including an entry for the tolerance:
| In[7]:= |
| Out[7]= |
When "Graphics" is specified, ResistorColorCode accepts the same options as Graphics:
| In[8]:= |
| Out[8]= |  |
ResistorColorCode can accept the results of the resource function FromResistorColorCode as an argument:
| In[9]:= |
| Out[9]= | 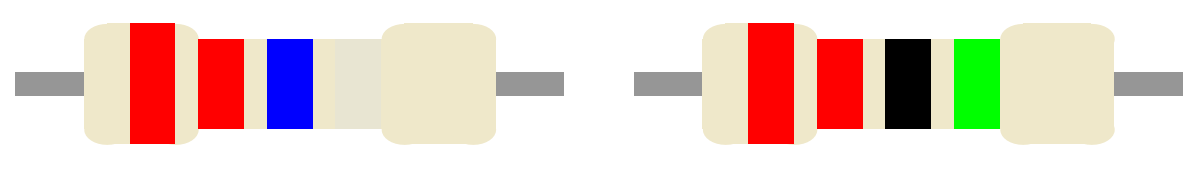 |
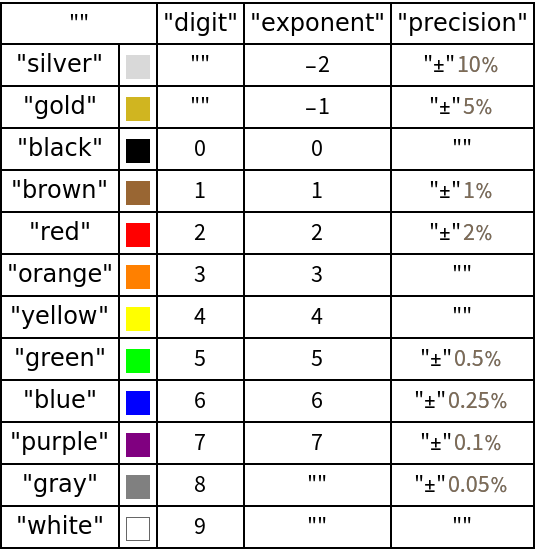
The following table can be used as a legend.
| In[1]:= | ![Diagram[] = Column[{Grid[{{"", SpanFromLeft, Text@"digit", Text@"exponent", Text@"precision"}, {Text@"silver", Graphics[{LightGray, Rectangle[]}, ImageSize -> 13], "", -2, Row[{"\[PlusMinus]", Quantity[10, "Percent"]}]}, {Text@"gold", Graphics[{RGBColor[0.8144808117799649`, 0.710933089188983`, 0.12820630197604332`], Rectangle[]}, ImageSize -> 13], "", -1, Row[{"\[PlusMinus]", Quantity[5, "Percent"]}]}, {Text@
"black", Graphics[{Black, Rectangle[]}, ImageSize -> 13], 0, 0,
""}, {Text@"brown", Graphics[{Brown, Rectangle[]}, ImageSize -> 13], 1, 1, Row[{"\[PlusMinus]", Quantity[1, "Percent"]}]}, {Text@"red", Graphics[{Red, Rectangle[]}, ImageSize -> 13], 2, 2, Row[{"\[PlusMinus]", Quantity[2, "Percent"]}]}, {Text@"orange", Graphics[{Orange, Rectangle[]}, ImageSize -> 13], 3, 3, ""}, {Text@"yellow", Graphics[{Yellow, Rectangle[]}, ImageSize -> 13], 4, 4, ""}, {Text@"green", Graphics[{Green, Rectangle[]}, ImageSize -> 13], 5, 5, Row[{"\[PlusMinus]", Quantity[.5, "Percent"]}]}, {Text@"blue", Graphics[{Blue, Rectangle[]}, ImageSize -> 13], 6, 6, Row[{"\[PlusMinus]", Quantity[.25, "Percent"]}]}, {Text@
"purple", Graphics[{Purple, Rectangle[]}, ImageSize -> 13], 7, 7, Row[{"\[PlusMinus]", Quantity[.1, "Percent"]}]}, {Text@
"gray", Graphics[{Gray, Rectangle[]}, ImageSize -> 13], 8, "", Row[{"\[PlusMinus]", Quantity[.05, "Percent"]}]}, {Text@"white",
Graphics[{White, Rectangle[]}, ImageSize -> 13, Frame -> True, FrameTicks -> None], 9, "", ""}}, Alignment -> Center, Dividers -> All]}]](https://www.wolframcloud.com/obj/resourcesystem/images/d18/d18d3423-7441-448d-9e20-a84f3876a85d/1ba3f7fb4046d7fc.png) |
This work is licensed under a Creative Commons Attribution 4.0 International License