Basic Examples (2)
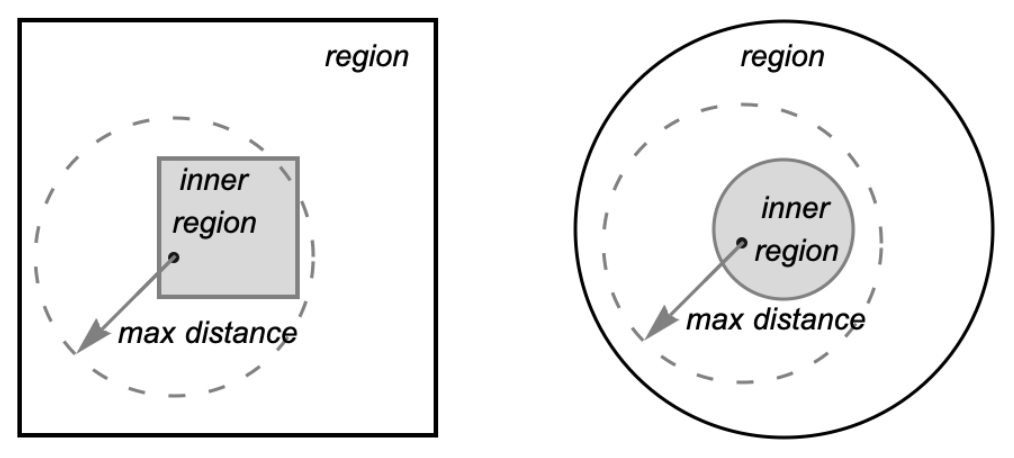
Define random points within a ball and visualize them:
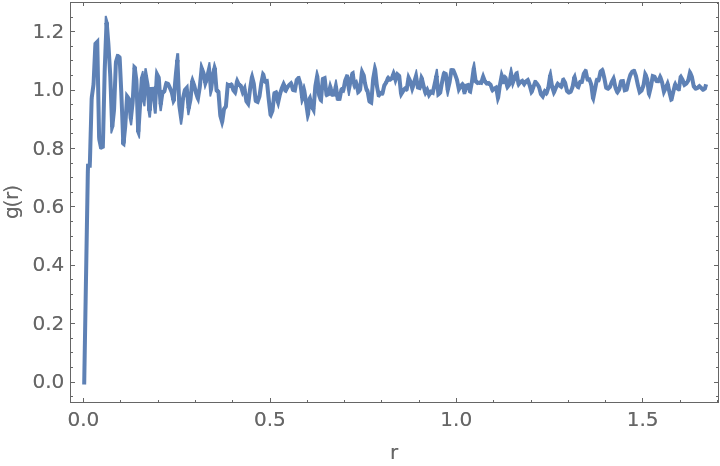
Compute the RDF for the points:
Plot it:
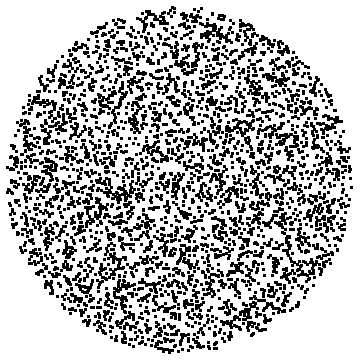
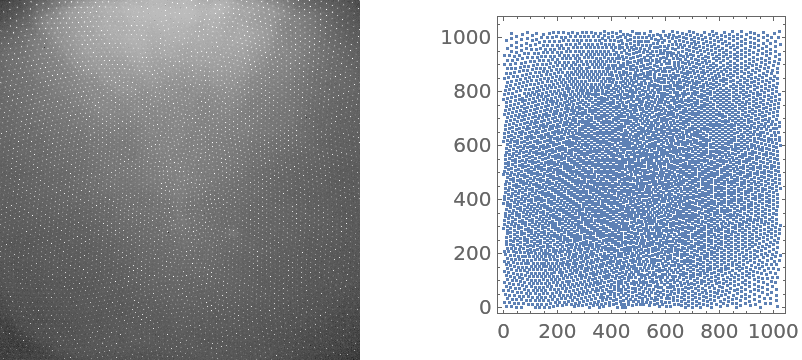
Detect the points in a crystal diffraction image:
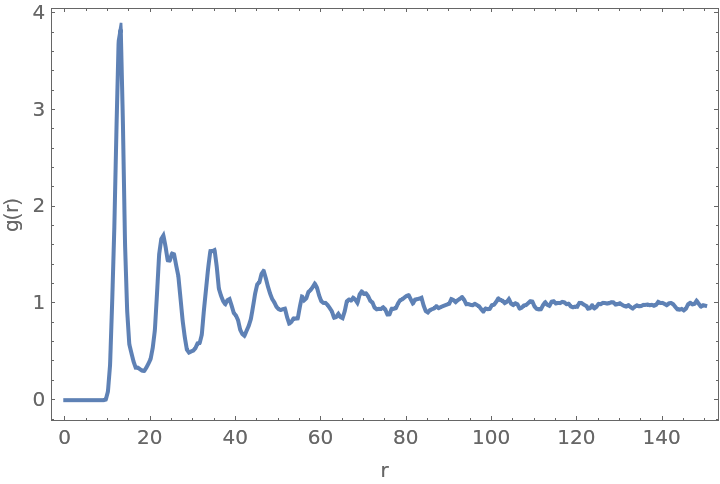
Compute the radial distribution function:
Plot the radial distribution function:
Scope (2)
Detect the points in a crystal diffraction image:
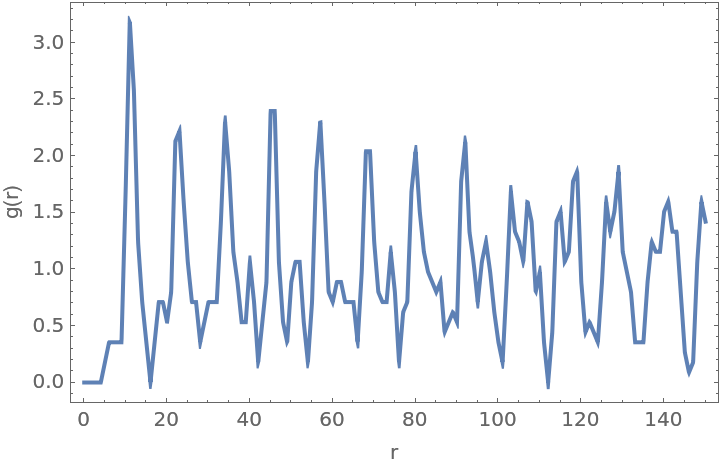
Generate pseudo 1-dimensional data from the image by extracting a narrow slice:
Define a 1-dimensional cuboid region:
Compute the radial distribution function:
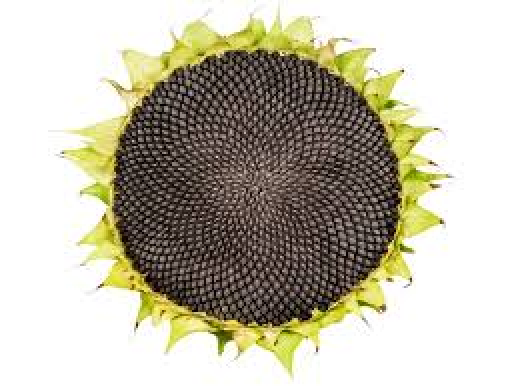
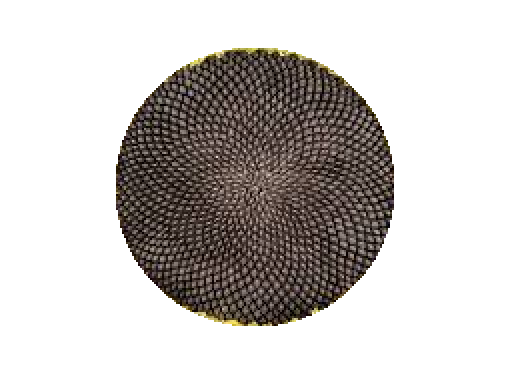
Use a circular region to generate the radial distribution function for sunflower seeds:
Use a mask to remove the petals:
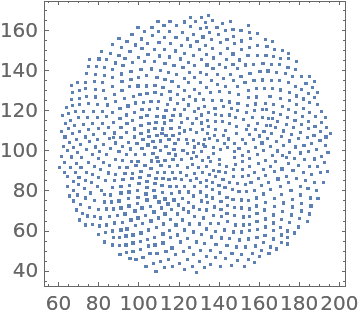
Detect the points representing the seeds:
Define the region (essentially the mask):
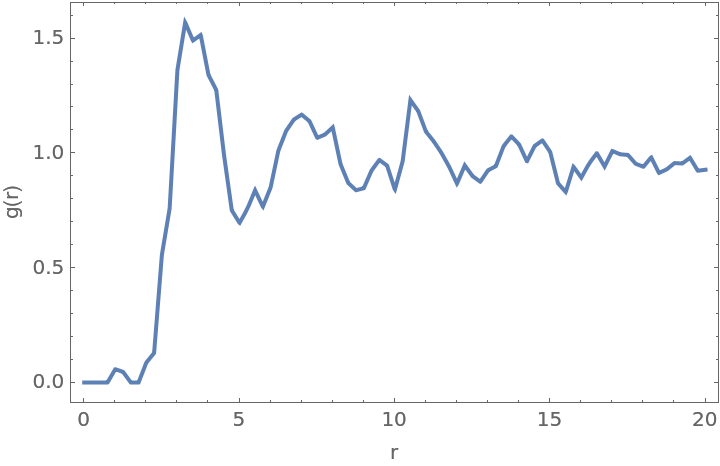
Compute the radial distribution function:
The integral of the first peak gives the approximate number of nearest nearest neighbors for a seed:
Applications (8)
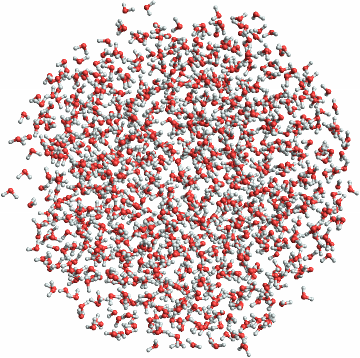
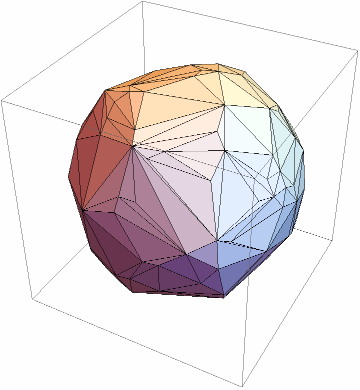
Here is a ball of 1118 water molecules approximately 40 Å in diameter:
Extract the coordinates of the oxygen atoms:
Compute the region by first finding the convex hull of the oxygen atoms:
Then find its centroid, find the distance of the hull point furthest from the centroid, and pad for the approximate diameter of a water molecule of 1.93 Å:
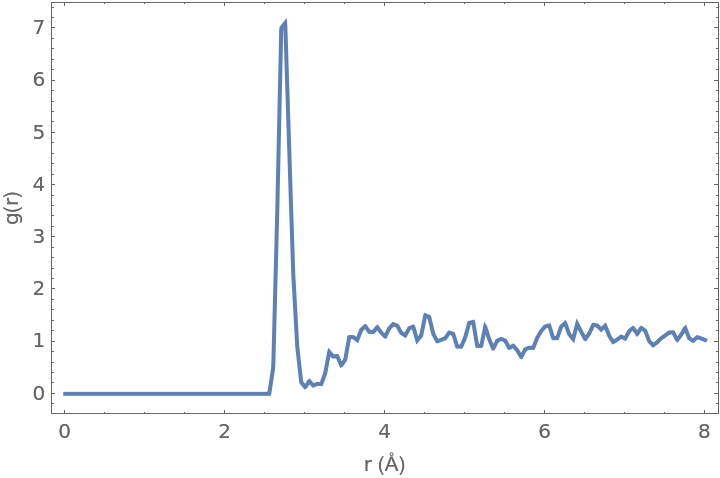
Compute the radial distribution function:
Plot it:
The approximate number of nearest oxygen atoms (water molecules) is:
The average distance is:
Neat Examples (2)
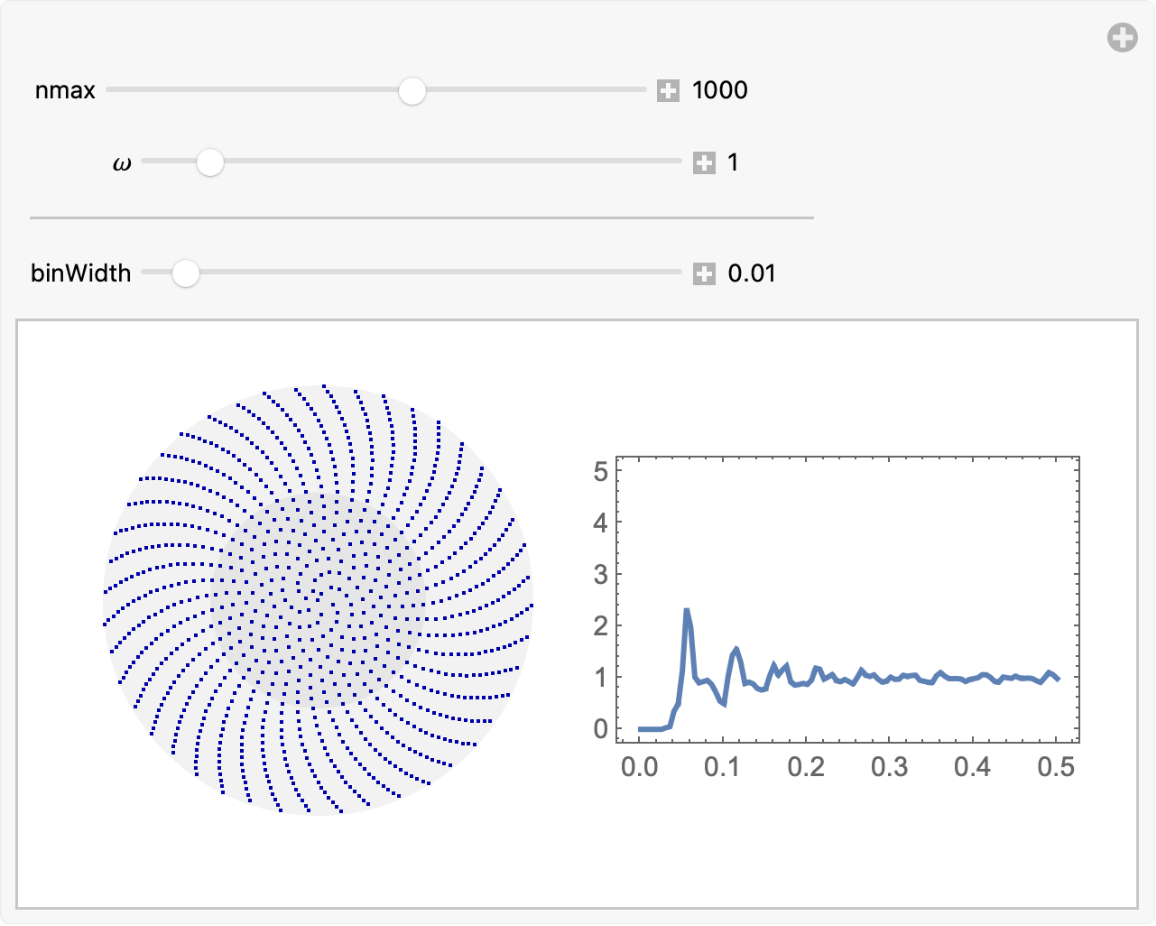
Interactive explorer:
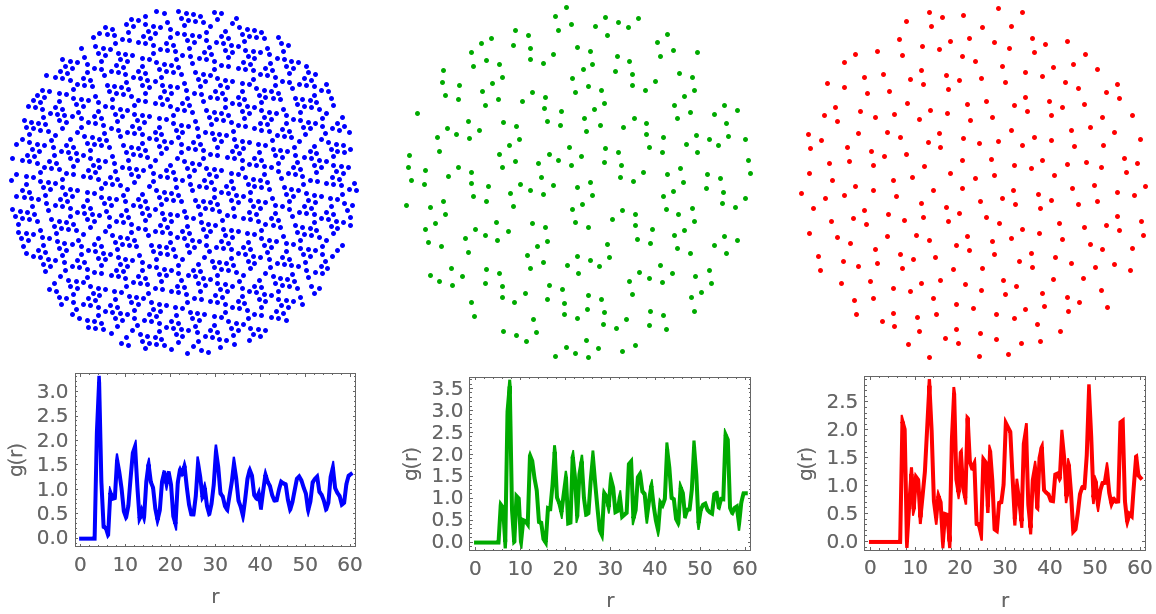
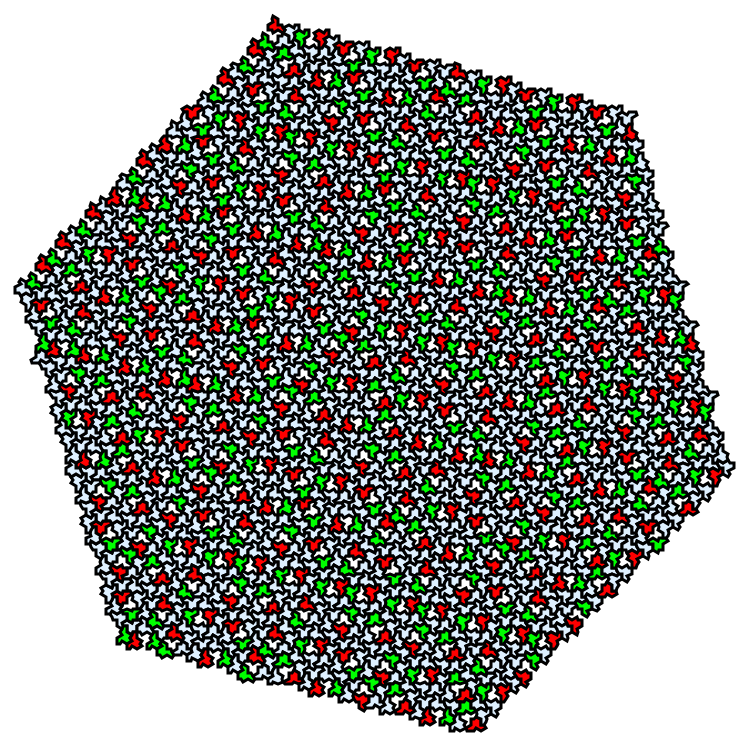
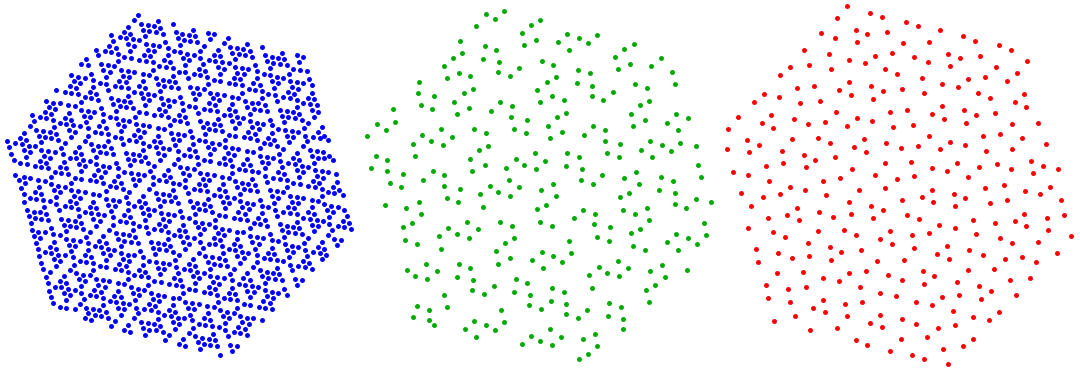
Generate a large patch of the Hat tiling:
Compute the mean of the coordinates of each polygon, and then group by color:
Select the points within the inscribed circle of the hexagonal patch:
Compute the radial distribution function for each group of points and plot it along with the points:
![(* Evaluate this cell to get the example input *) CloudGet["https://www.wolframcloud.com/obj/a3fb542d-58e1-465f-9052-2f39423875d3"]](https://www.wolframcloud.com/obj/resourcesystem/images/9cf/9cf598f6-0ec2-4104-a7b2-74745a9249fb/1-0-0/4d2611a3be0b4df8.png)

![seedPoints = Values@ComponentMeasurements[
Binarize@
ImageSubtract[maskedImage, BilateralFilter[image, 4, 1]], "Centroid"] // Select[Last[#] > 36 &] // Echo[#, "", Length] &;
ListPlot[seedPoints, AspectRatio -> Automatic, PlotRange -> MinMax /@ Transpose@seedPoints, PlotRangePadding -> Scaled[.05], ImageSize -> Small]](https://www.wolframcloud.com/obj/resourcesystem/images/9cf/9cf598f6-0ec2-4104-a7b2-74745a9249fb/1-0-0/53321ab651a35995.png)
![(* Evaluate this cell to get the example input *) CloudGet["https://www.wolframcloud.com/obj/dae5788c-0980-40ea-8ef6-15c51fdcc53a"]](https://www.wolframcloud.com/obj/resourcesystem/images/9cf/9cf598f6-0ec2-4104-a7b2-74745a9249fb/1-0-0/12bf491d45c048fd.png)
![oxygenAtoms = Thread[{waterBall["AtomList"], waterBall["AtomCoordinates"]}] // Cases[#, {Atom["O"], xyz_} :> QuantityMagnitude@xyz] &;
oxygenAtoms // Short](https://www.wolframcloud.com/obj/resourcesystem/images/9cf/9cf598f6-0ec2-4104-a7b2-74745a9249fb/1-0-0/58c76a293ae8d4c5.png)
![DynamicModule[{nmax = 3},
Manipulate[
Module[{M = Floor[10^nmax], pts, \[ScriptR]\[ScriptD]\[ScriptF]}, pts = Table[
Sqrt[k/M] {Cos[\[Omega] k], Sin[\[Omega] k]}, {k, 0., M}];
\[ScriptR]\[ScriptD]\[ScriptF] = ResourceFunction["RadialDistributionFunction"][pts, Ball[{0, 0}, 1], binWidth];
GraphicsRow[{Graphics[{GrayLevel[0.95], Disk[], GrayLevel[0.9], Disk[{0, 0}, 1/2], Darker[Blue], AbsolutePointSize[1], Point[pts]}, ImageSize -> Small], Plot[\[ScriptR]\[ScriptD]\[ScriptF][r], {r, 0, 1/2}, PlotRange -> {0, 5}, PlotRangePadding -> Scaled[.05], Axes -> False, Frame -> True, ImageSize -> Small(*,AspectRatio->
4/5*)]}]], Row[{Control[{{nmax, 3}, 1, 4.5}], " ", Dynamic[Floor[10^nmax]]}], {{\[Omega], 1}, 0, 10, Appearance -> "Labeled"}, Delimiter, {{binWidth, 0.01}, 0.005, 0.1, Appearance -> "Labeled"}]
]](https://www.wolframcloud.com/obj/resourcesystem/images/9cf/9cf598f6-0ec2-4104-a7b2-74745a9249fb/1-0-0/78850730460c4134.png)
![(* Evaluate this cell to get the example input *) CloudGet["https://www.wolframcloud.com/obj/369cf84d-19e7-46e1-9638-db13e7a3e1bb"]](https://www.wolframcloud.com/obj/resourcesystem/images/9cf/9cf598f6-0ec2-4104-a7b2-74745a9249fb/1-0-0/6c8cb51472f54519.png)
![points = GroupBy[First@
tiling, (Replace[#[[2]], {LightBlue -> Blue, Green -> Darker@Green}] &) -> (Apply[Mean, #[[3]]] &)] // N;](https://www.wolframcloud.com/obj/resourcesystem/images/9cf/9cf598f6-0ec2-4104-a7b2-74745a9249fb/1-0-0/7960abea24da4130.png)
![KeyValueMap[{color, coords} |-> Graphics[{color, AbsolutePointSize[2], Point[coords]}, ImageSize -> Small], points] // Row](https://www.wolframcloud.com/obj/resourcesystem/images/9cf/9cf598f6-0ec2-4104-a7b2-74745a9249fb/1-0-0/08d76b30cb0072bd.png)
![KeyValueMap[{color, coords} |-> Column[{Graphics[{{color, AbsolutePointSize[2], Point[coords]}}, ImageSize -> Small], \[ScriptCapitalR]\[ScriptCapitalD]\[ScriptCapitalF] = ResourceFunction["RadialDistributionFunction"][coords, Ball[Mean[coords], 95], 1]; Plot[\[ScriptCapitalR]\[ScriptCapitalD]\[ScriptCapitalF][r], {r, 0, 60}, PlotStyle -> color, ImageSize -> Small, PlotRange -> All, Axes -> False, Frame -> True, FrameLabel -> {"r", "g(r)"}]}], points] // Row[#, Spacer[9]] &](https://www.wolframcloud.com/obj/resourcesystem/images/9cf/9cf598f6-0ec2-4104-a7b2-74745a9249fb/1-0-0/247032524ab449f4.png)
