Wolfram Function Repository
Instant-use add-on functions for the Wolfram Language
Function Repository Resource:
Show numerical data in a radar-style chart
ResourceFunction["RadarChart"][<|lbl1→val1,lbl2→val2,…|>,…] plots each of the vali in a radar chart with labels lbli. |
Show values in a radar chart:
| In[1]:= |
| Out[1]= | 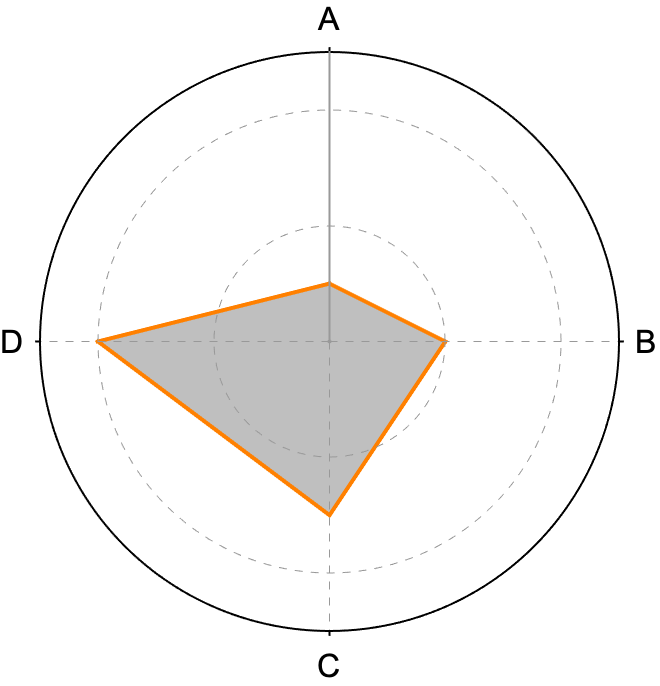 |
Use a different color:
| In[2]:= |
| Out[2]= | 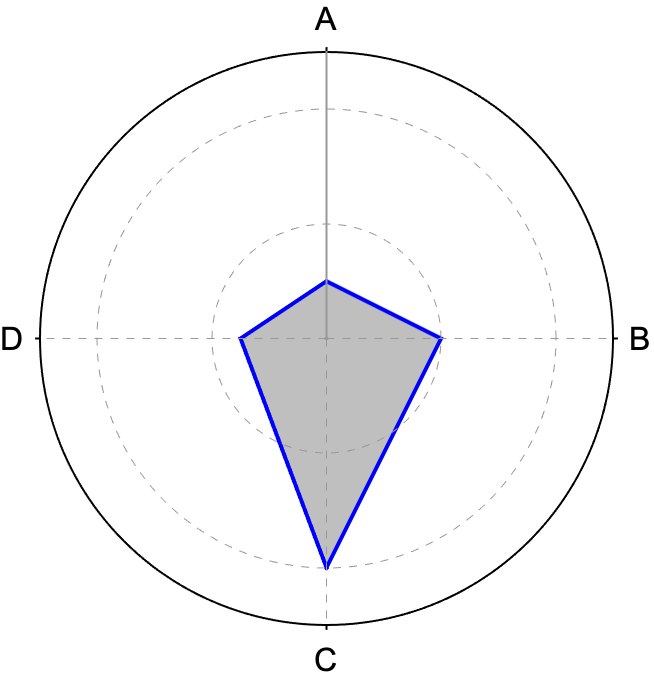 |
By default, the largest value is used to determine the maximum plot range:
| In[3]:= |
| Out[3]= | 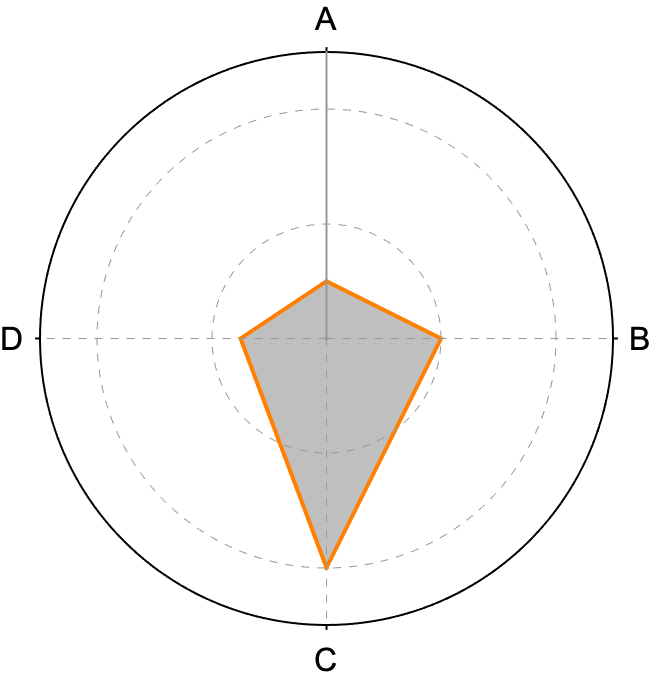 |
Use PlotRange to explicitly set a value:
| In[4]:= |
| Out[4]= | 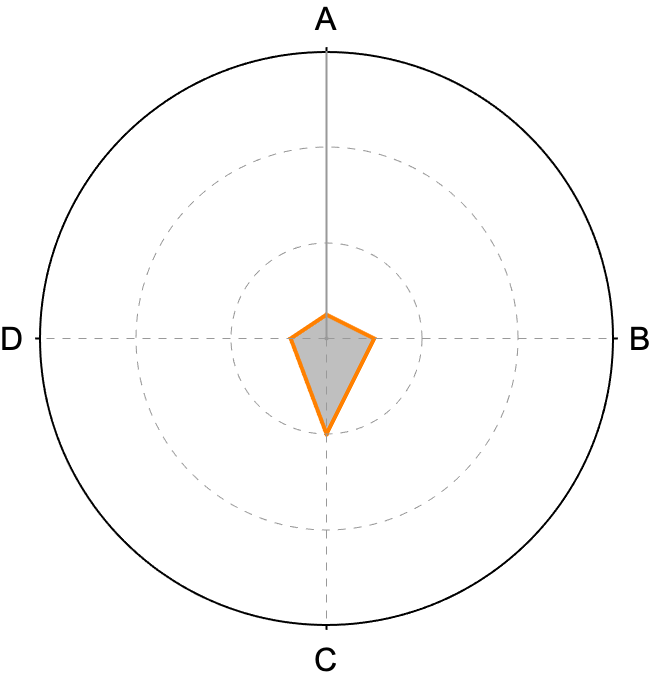 |
Gather and compare the nutrition content of two foods:
| In[5]:= | ![foodToNutrition = EntityValue[{Entity["Food", "McdonaldsBigMacWithoutBigMacSauce::zxvg9"], Entity["Food", "SweetPotatoCannedMashed::7w373"]}, {"RelativeTotalProteinContent", "RelativeTotalCarbohydratesContent", "RelativeTotalFatContent", "RelativeTotalFiberContent"}, "EntityPropertyAssociation"]](https://www.wolframcloud.com/obj/resourcesystem/images/51f/51f89269-aa6d-47e1-9e90-b11b87e32d39/3d6b37c8d1f7b69b.png) |
| Out[5]= | 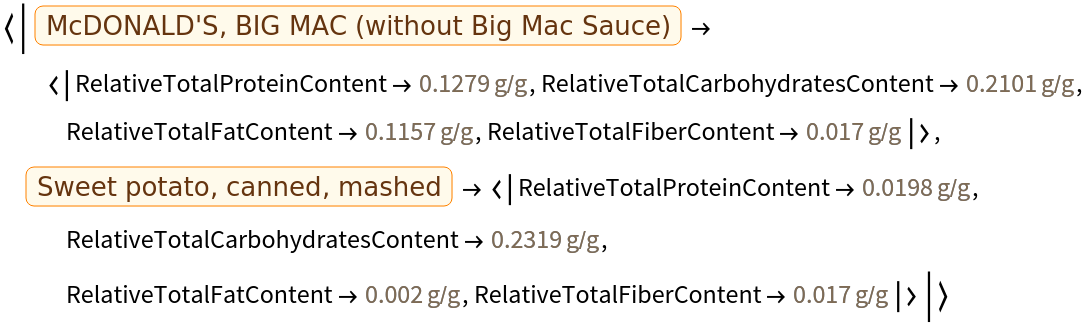 |
Visualize the foods in radar plots:
| In[6]:= |
| Out[6]= | 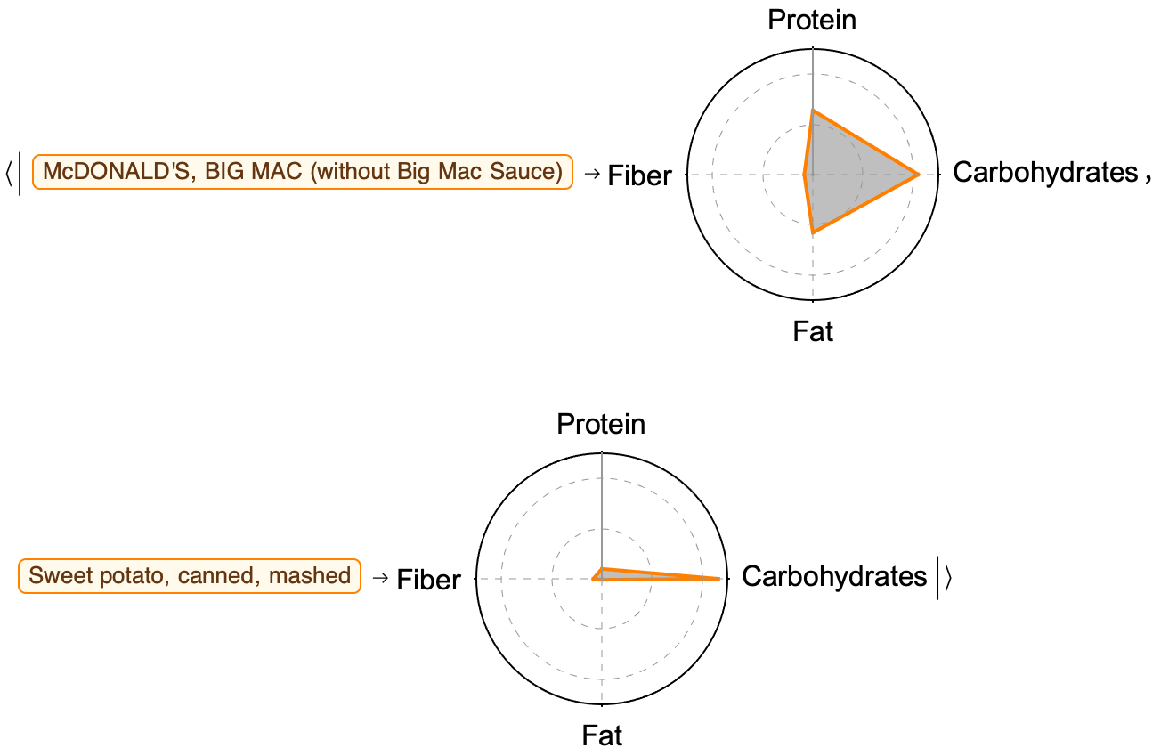 |
This work is licensed under a Creative Commons Attribution 4.0 International License