Wolfram Function Repository
Instant-use add-on functions for the Wolfram Language
Function Repository Resource:
Plot the positions of pulsars in a P-Ṗ diagram
ResourceFunction["PulsarPDotDiagram"][entities] plots the positions of the specified entities on a P‐Ṗ diagram. |
Plot single pulsars on the P‐Ṗ diagram:
| In[1]:= |
| Out[1]= | 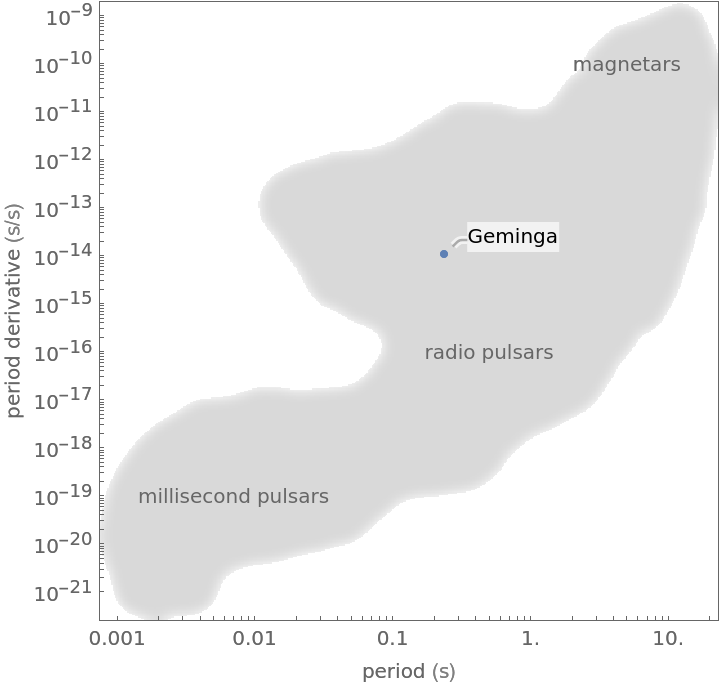 |
Plot multiple pulsars on the P‐Ṗ diagram:
| In[2]:= |
| Out[2]= | 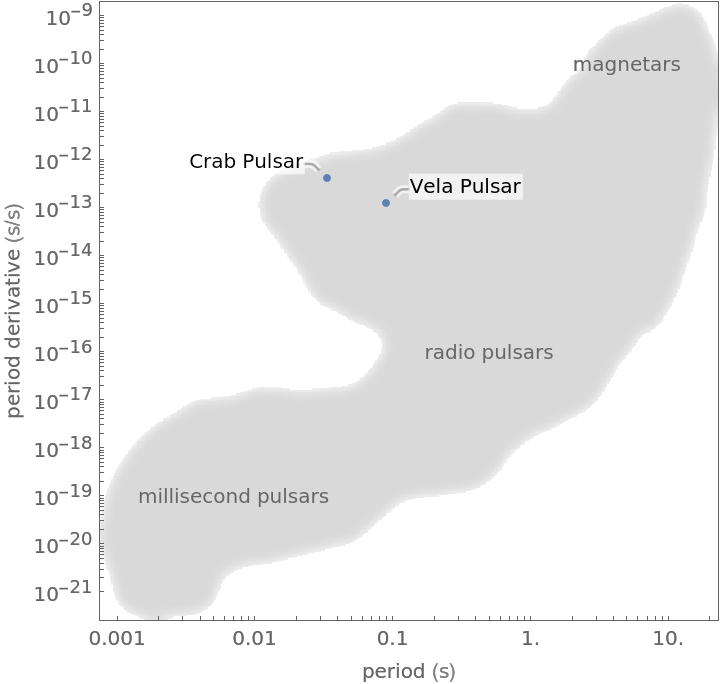 |
Plot entity classes of pulsars on the P‐Ṗ diagram:
| In[3]:= |
| Out[3]= | 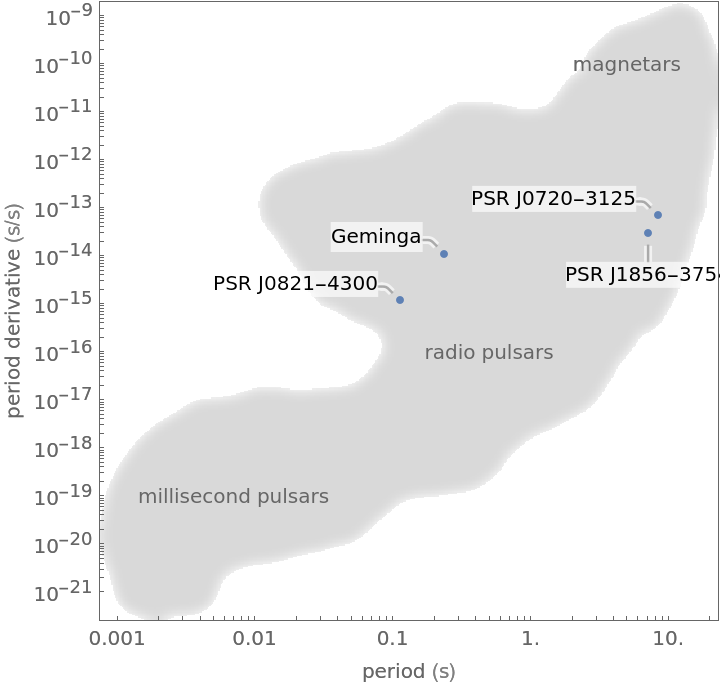 |
Change the color of the pulsar(s) with the option PlotStyle:
| In[4]:= |
| Out[4]= | 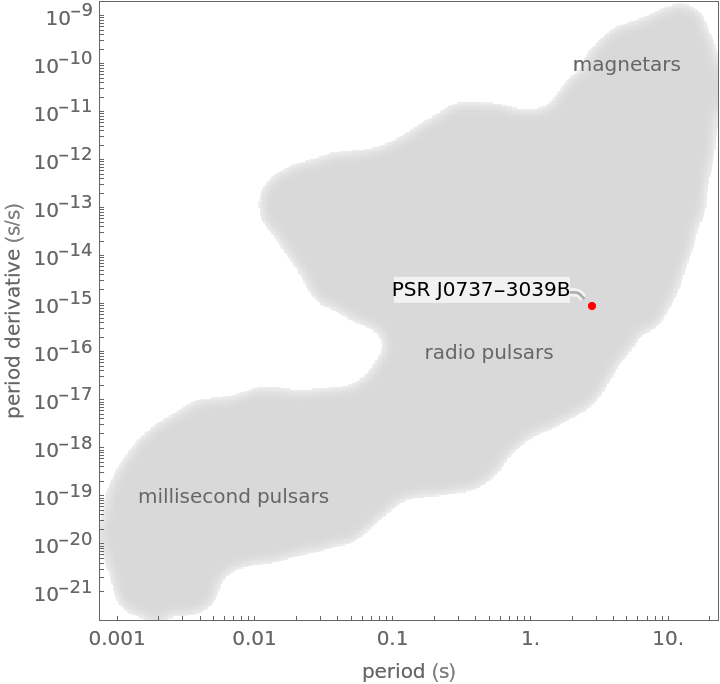 |
Change the formatting of the background with the option PlotTheme:
| In[5]:= |
| Out[5]= | 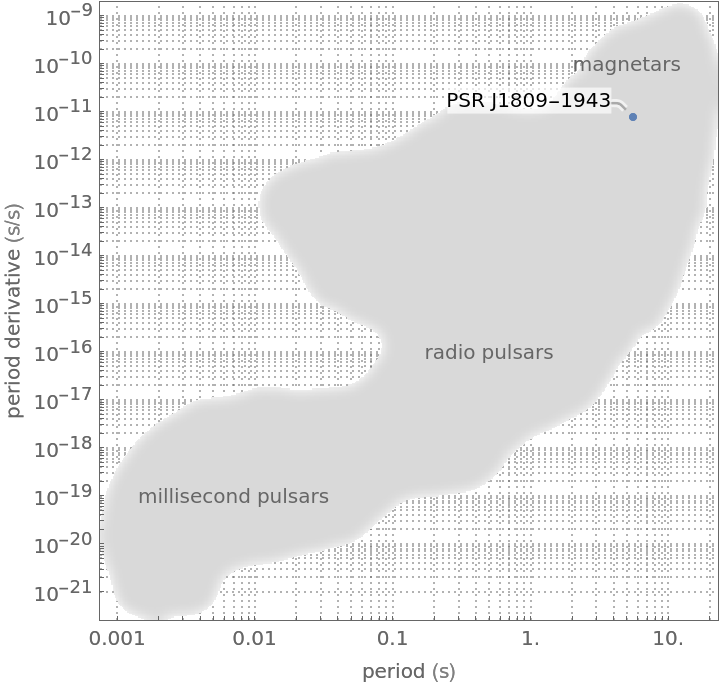 |
Binary pulsars are correlated with millisecond pulsars which are "spun up" due to mass transfer, decreasing the rotation period:
| In[6]:= |
| Out[6]= | 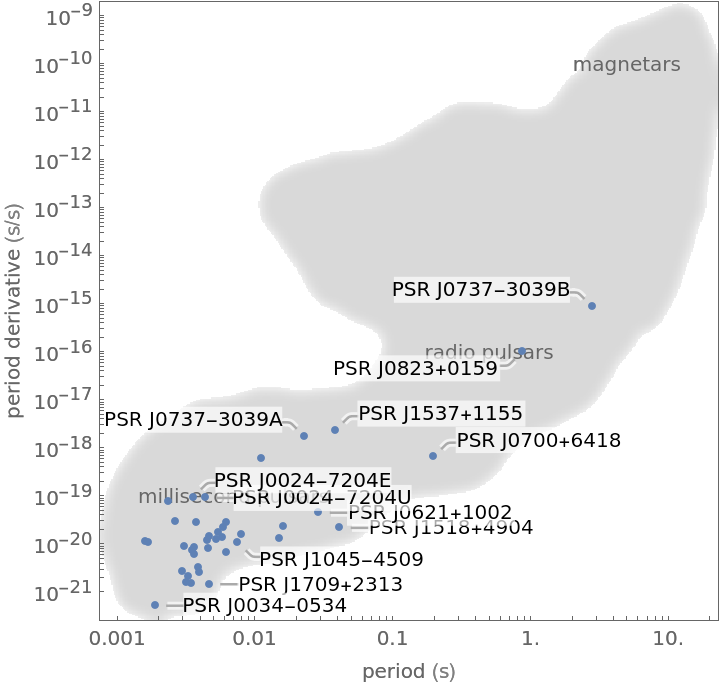 |
Magnetars undergo more magnetic braking and thus a higher rotation period derivative as they slow down with age along with slower rotation compared to other pulsars:
| In[7]:= |
| Out[7]= | 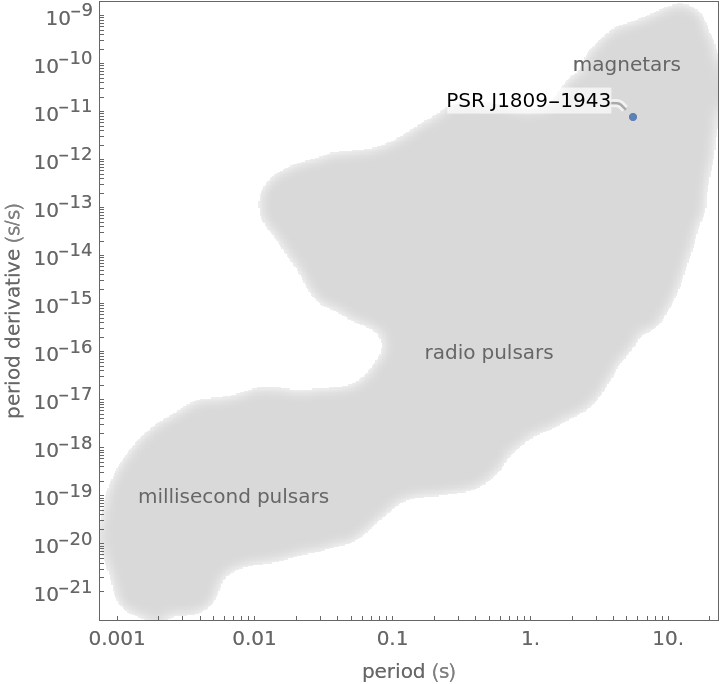 |
This work is licensed under a Creative Commons Attribution 4.0 International License